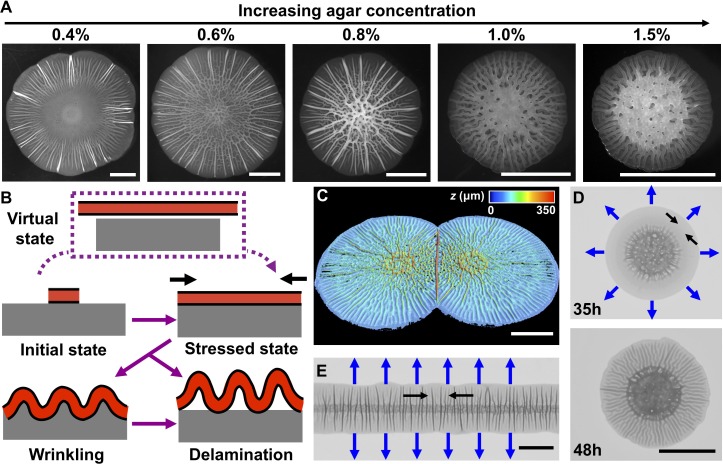
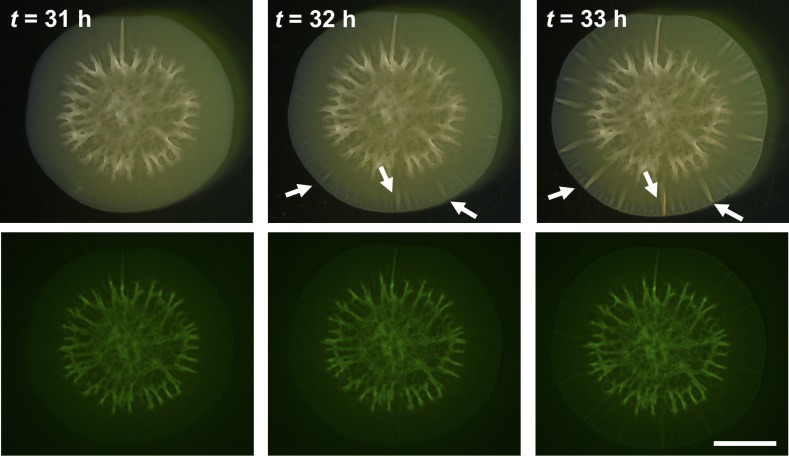
Figure 1. Mechanical instability drives V. cholerae biofilm morphogenesis.
(A) Bright-field images of biofilms grown for 2 days on the designated percentages of agar. (B) Schematic of the wrinkling and delamination processes that occur during biofilm expansion. Red with a black outline denotes the biofilm. Gray denotes the substrate, agar in this case. (C) Three-dimensional (3D) profile of two colliding biofilms, initially inoculated 9 mm apart, grown on a 0.6% agar plate for 36 hr. (D) Transmission image of a V. cholerae biofilm grown for 35 hr (top) and 48 hr (bottom) on a 1.0% agar plate. (E) Transmission image of a V. cholerae biofilm inoculated as a line and grown for 30 hr on a 0.5% agar plate. In panels (D) and (E), blue arrows denote the expansion directions, and black arrows denote the tangential directions along which compressive stress accumulates. All scale bars are 5 mm.


