. 2019 Mar 8;8:e43920. doi: 10.7554/eLife.43920

Figure 2. A trilayer mechanical model predicts the intrinsic wavelength of the biofilm pattern.

(A) Number of wrinkles or blisters N versus the radial coordinate r during biofilm growth. The color scale indicates growth time t. Inset: closeup transmission image of a growing biofilm showing that wrinkles or blisters bifurcate to maintain a constant λ. Agar concentration: 0.7%, scale bar: 2 mm. (B) The scaling relationship between λ (normalized by the biofilm thickness h) and the shear modulus ratio Gf/Gs between the biofilm and the agar substrate. The black line indicates a slope of 1/3 on a log-log scale. (C) Characterization of the residual layer. Top: 3D topography of the residual layer after peeling a biofilm off of an agar substrate. Bottom: height profile extracted along the contour indicated by the dashed red line in the top panel. Both the raw (black) and smoothed (red) data, from which the residual layer thickness hr was calculated, are shown. Agar concentration: 0.5%. (D) Replot of the data in panel (B) taking into account the residual layer. The corrected biofilm thickness hf was obtained by subtracting the residual thickness hr from the total thickness h. The solid portion of the black line corresponds to the prediction from the bilayer model, which applies only to x coordinates greater than 4.75 (Wang and Zhao, 2015). The dashed portion of the black line is an extrapolation to zero from the bilayer prediction provided as a guide to the eye. The red line is the fitted data from the trilayer model in which the stiffness contrast between the residual and biofilm layers Gr/Gf is treated as a fitting parameter while holding hr/hf = 0.3. Inset: finite-element simulation of the trilayer model undergoing wrinkling instability. Red denotes the biofilm. Gray denotes the substrate. Blue denotes the residual layer. Simulation parameters were chosen to mimic the growth condition on 1.0% agar (black arrow). Data are represented as mean ± std with n = 3.

Figure 2—source data 1. Experimental measuremants of biofilm residual layer thicknesses and wavelengths and predictions from trilayer wrinkling theory.
elife-43920-fig2-data1.xlsx (105.8KB, xlsx)
DOI: 10.7554/eLife.43920.010

Figure 2.

Figure 2—figure supplement 1. Analysis of intrinsic wavelengths in the morphologies of biofilms.

Figure 2—figure supplement 1.

(A) Experimental setups for imaging biofilm morphogenic development. Left: schematic of the imaging system used for the analysis of biofilm patterns and biofilm expansion. An agar plate with cells inoculated onto it was placed on a white-light LED board, under a camera that detects transmitted light. Right: schematic of the imaging system used for simultaneous acquisition of top and side views for analysis of biofilm morphogenesis. A growing biofilm was illuminated with a white-light LED board from the side, and two cameras were employed to detect the scattered light from above and from the side. In both setups, red denotes the biofilm and gray denotes the agar substrate. (B,C) Number of wrinkles or blisters N versus the radial coordinate r during biofilm expansion is plotted on the left, with the image of the corresponding biofilm at 48 hr shown on the right, for (B) agar concentration = 0.8% and (C) agar concentration = 1.0%. The color scale indicates growth time t. We note that the characteristic length of the pattern inside the nutrient-limited zones (outlined with the red dotted circles in panels (B) and (C), images on the right), differs from that of the morphological pattern outside of the zones because the morphology inside the biofilm core has been shown to arise from localized cell death (Asally et al., 2012; Yan et al., 2017). In panel (B), the cyan ring denotes a typical radius in the radial pattern region along which N was counted. Scale bars: 2 mm. (D) Comparison of the wavelengths of the patterns for biofilms grown on identical agar substrates (0.5% agar) but in different initial geometries (circle (white) versus line (gray)). Unpaired t-tests with Welch’s correction were performed for statistical analyses. p-value = 0.394. NS denotes not significant. Data are represented as mean ± std with n = 3.
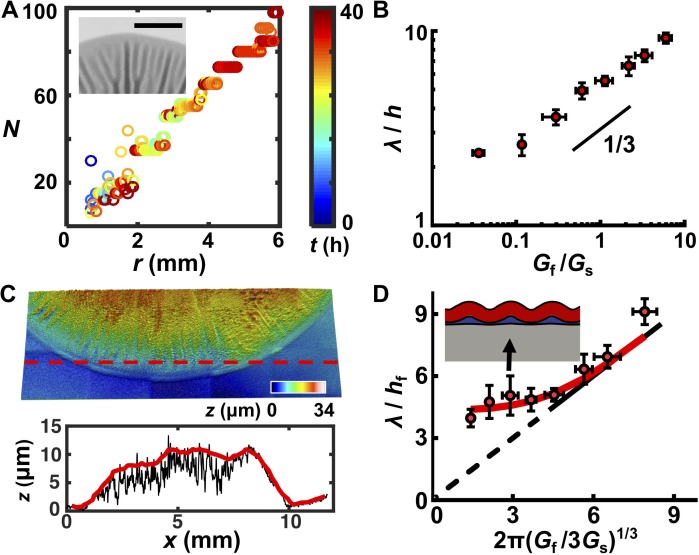
Figure 2—figure supplement 1—source data 1. Biofilm wavelength analysis.
DOI: 10.7554/eLife.43920.012
Figure 2—figure supplement 2. Capillary peeling reveals a residual layer between the biofilm and the substrate.

Figure 2—figure supplement 2.

(A) Schematic of the capillary peeling process (see also Yan et al., 2018). Top: the proposed trilayer biofilm model includes a residual layer (blue) between the biofilm layer (red) and the agar substrate (gray). Cyan represents the slowly injected liquid. The weak interface between the biofilm layer and the residual layer is separated by the penetrating liquid, leaving the residual layer on the agar substrate. h denotes the total thickness of the biofilm. hr denotes the residual layer thickness. Bottom left: a closeup version of the schematic representation of liquid penetration between the biofilm and residual layers during the capillary peeling process. (B) Comparison of the corrected biofilm thickness hf (red, obtained from hf = h – hr) and the residual layer thickness hr (blue), as a function of agar concentration. hf changes minimally with changing agar concentrations. Thus, we hypothesize that the final thickness of the biofilm layer is set by the availability of oxygen, which can generally penetrate into a biofilm to a distance of tens of microns (Okegbe et al., 2014). Data are represented as mean ± std with n = 3. (C) The residual layer between the biofilm and the substrate contains primarily matrix material. Top: bright field images. Middle: Oregon green conjugated wheat germ agglutinin (WGA) staining for extracellular polysaccharide (Berk et al., 2012). Bottom: the signal from a constitutive mKate2 transcriptional fusion that marks cells. A V. cholerae biofilm expressing mKate2 was grown for 2 days on a 0.5% agar substrate, stained with WGA, and subsequently imaged (left). After the biofilm was peeled off the substrate using the capillary method from panel (A), the agar substrate was imaged again (middle). After biofilm peeling, a weak signal can be observed in the WGA channel but not in the mKate2 channel, suggesting that the residual layer contains primarily extracellular polysaccharide but not live cells. As a control, an identically treated sterile agar substrate is shown (right). Scale bar: 2 mm.
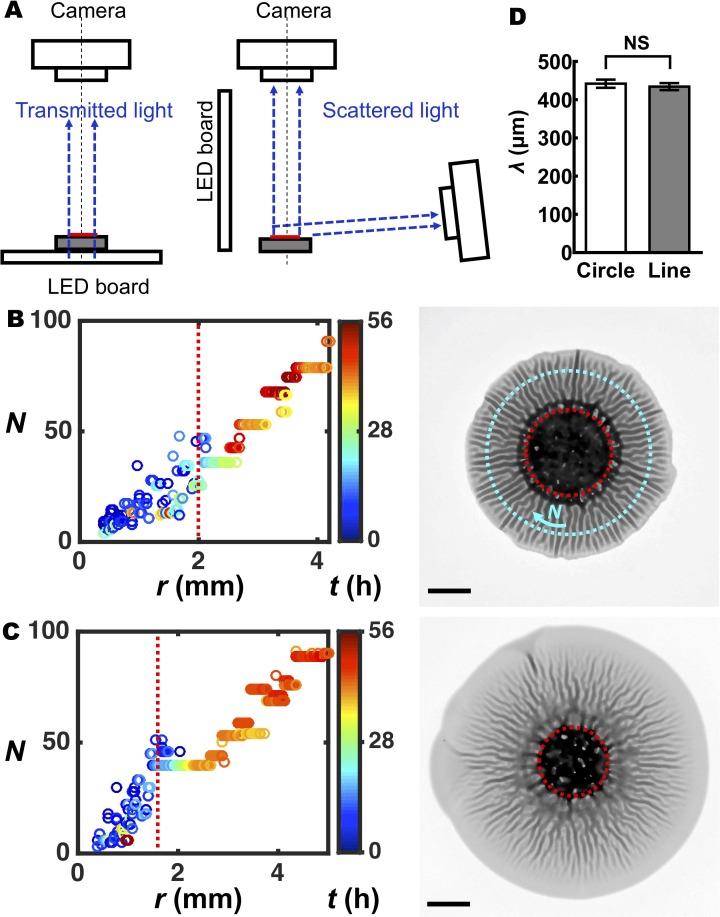
Figure 2—figure supplement 2—source data 2. Thicknesses of the biofilm and residual layers.
DOI: 10.7554/eLife.43920.014
Figure 2—figure supplement 3. The biofilm residual layer consists primarily of polysaccharide.

Figure 2—figure supplement 3.

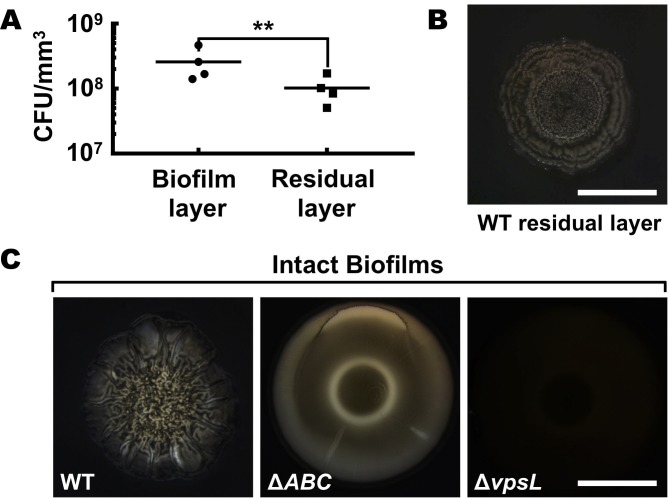
(A) Normalized CFU (colony forming units) in the biofilm and the residual layers for 2-day-old biofilms grown on a 0.6% agar substrate. Paired t-tests (n = 4) were performed for statistical analyses. ** denotes p-value < 0.01. (B) Bright field image of the residual biofilm layer from a WT biofilm counter-stained with India ink, which is excluded by polysaccharides. (C) Control experiments for panel (B). Bright field images of intact WT (left), ΔrbmA Δbap1 ΔrbmC (denoted ΔABC, lacking key matrix proteins but possessing the key matrix polysaccharide) (middle) and ΔvpsL (lacking the key matrix polysaccharide) (right) biofilms counter-stained with India ink. India ink is excluded from the biofilm and residual layer when the key matrix polysaccharide is present (WT residual layer, WT biofilm, ΔABC biofilm) but not when the key matrix polysaccharide is absent (ΔvpsL biofilm). The cells themselves do not exclude the India ink (as shown by the ΔvpsL mutant biofilm). We take these findings as preliminary evidence to suggest that the residual biofilm layer is primarily composed of polysaccharide. We do not exclude the possibility that the residual layer could also contain membrane, proteins, and other components. Scale bars: 5 mm.
Figure 2—figure supplement 3—source data 3. Cell counts in biofilm and residual layers.
DOI: 10.7554/eLife.43920.016
Figure 2—figure supplement 4. The trilayer biofilm morphology model predicts the wrinkling wavelength observed in the experiments.

Figure 2—figure supplement 4.

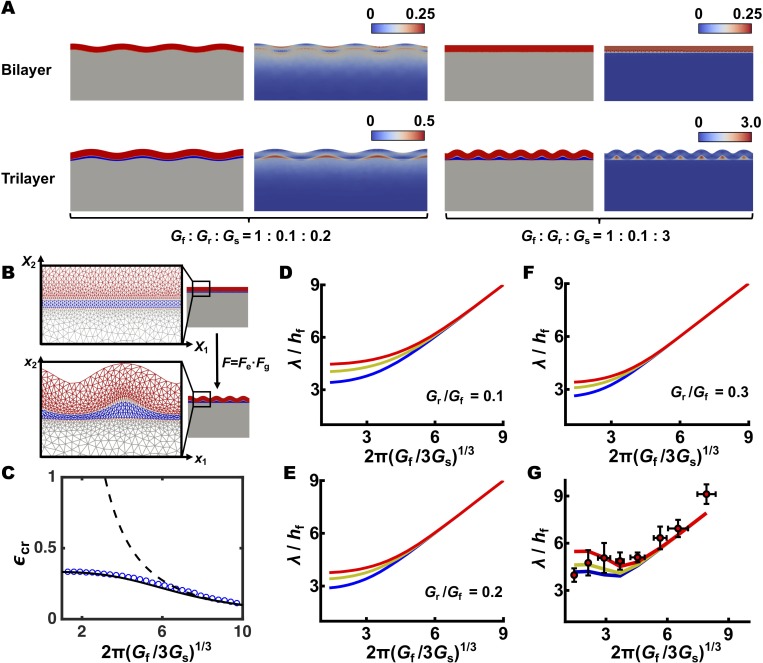
(A) Comparison of simulations of a bilayer model (top) and a trilayer model (bottom) following constrained biofilm growth. Left: both models predict surface wrinkling when the biofilm is stiffer than the substrate. Gf/Gs = 5.0 and the growth-induced compressive strain ε = 0.2. Right: when the substrate is stiffer than the biofilm, the biofilm remains flat in the bilayer model, but wrinkles in the trilayer model. Gf/Gs = 1/3 and ε = 0.32. Parameters for the residual layer in the trilayer model are: Gr/Gf = 0.1 and hr/hf = 0.3 in all simulations. For each simulation, the resulting configuration and strain distribution are shown side by side. First and third panels: color code as in Figure 2D. Second and fourth panels: color code denotes the von Mises equivalent strain (Jones, 2009). (B) Schematic of the trilayer simulation. Three layers are subdivided into finite elements (left). The coordinates in the initial and final deformed states are denoted by X and x, respectively, and are connected by a deformation tensor F. The total deformation can be further decomposed into two parts, one caused by growth Fg and another by elastic deformation Fe. (C) Comparison of the critical compressive strain εcr for wrinkling predicted by bilayer and trilayer models. The bilayer wrinkling pattern would yield an εcr larger than one for small Gf/Gs (corresponding to high agar concentrations in the biofilm growth experiment), which is physically inaccessible (dashed black curve). By contrast, the εcr predicted by the trilayer model (solid black curve, theory; blue circles, simulation) saturates at a value less than 1. Therefore, for small Gf/Gs (<1.3), a wrinkling instability is predicted by the trilayer model but not by the bilayer model. (D–F) Theoretical predictions of the scaling relationships between the normalized wrinkling wavelength λ/hf and the stiffness ratio Gf/Gs in the trilayer model. The modulus ratio between the residual layer and the biofilm is constant (Gr/Gf = 0.1, 0.2, and 0.3 for panels (D–F), respectively). The thickness ratio of the residual layer to the biofilm layer hr/hf is varied from 0.1, 0.2, to 0.3, corresponding to the blue, yellow, and red curves, respectively. (G) As an alternative approach to the fitting procedure represented in Figure 2D, we used the experimentally determined hr/hf and Gf for each growth condition and we varied the Gr/Gf ratio from 0.1, to 0.2, to 0.3 as shown by the blue, yellow, and red curves, respectively. Experimental data (red circles) are represented as mean ± std with n = 3.
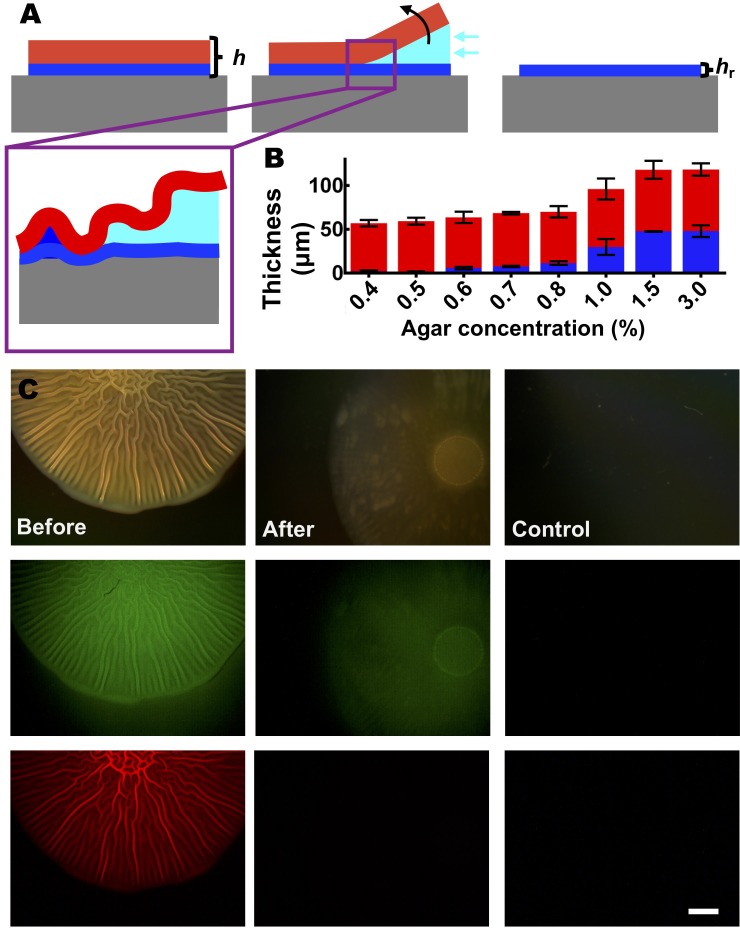
Figure 2—figure supplement 4—source data 4. Theoretical and computational models for trilayer wrinkling.
DOI: 10.7554/eLife.43920.018