. 2019 Mar 11;8:e43630. doi: 10.7554/eLife.43630

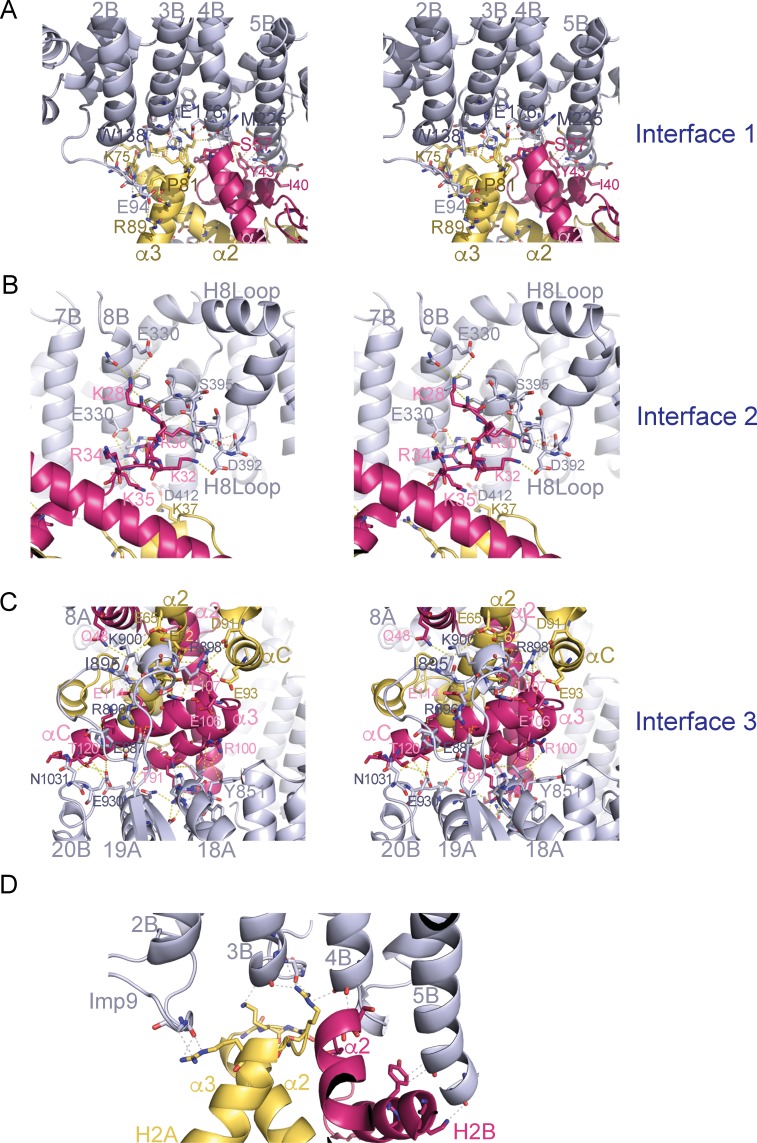
Figure 2. Imp9 •H2A-H2B binding interfaces.

(A) The Imp9•H2A-H2B structure is oriented as in Figure 1C. The histones H2A (yellow)-H2B (red) are drawn as cartoons. Imp9 (blue) is represented as surface showing three distinct H2A-H2B binding interfaces (dark blue). (B–D). Details of Interface 1 (B), Interface 2 (C) and Interface 3 (D). Intermolecular contacts are shown as dashed lines.

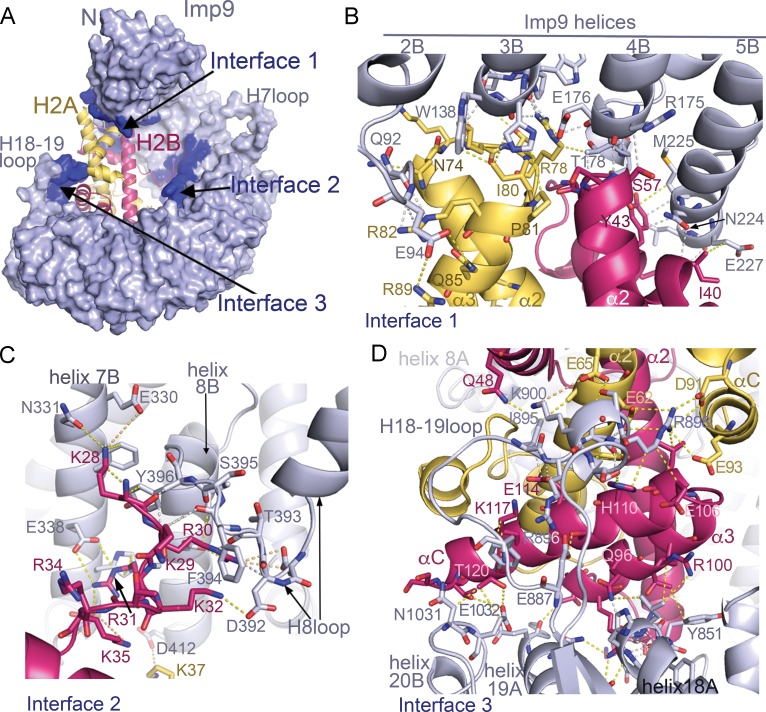
Figure 2.

Figure 2—figure supplement 1. Stereo views of the Imp9•H2A-H2B interfaces.

Figure 2—figure supplement 1.

(A-C) Cross-eyed stereo view of Interface 1 (A), Interface 2 (B) and Interface 3 (C). (D) Interactions between the main chain of Imp9 and H2A-H2B. Interactions between Imp9 (blue) and the histones (H2A is yellow and H2B is red) are shown with dashed lines.
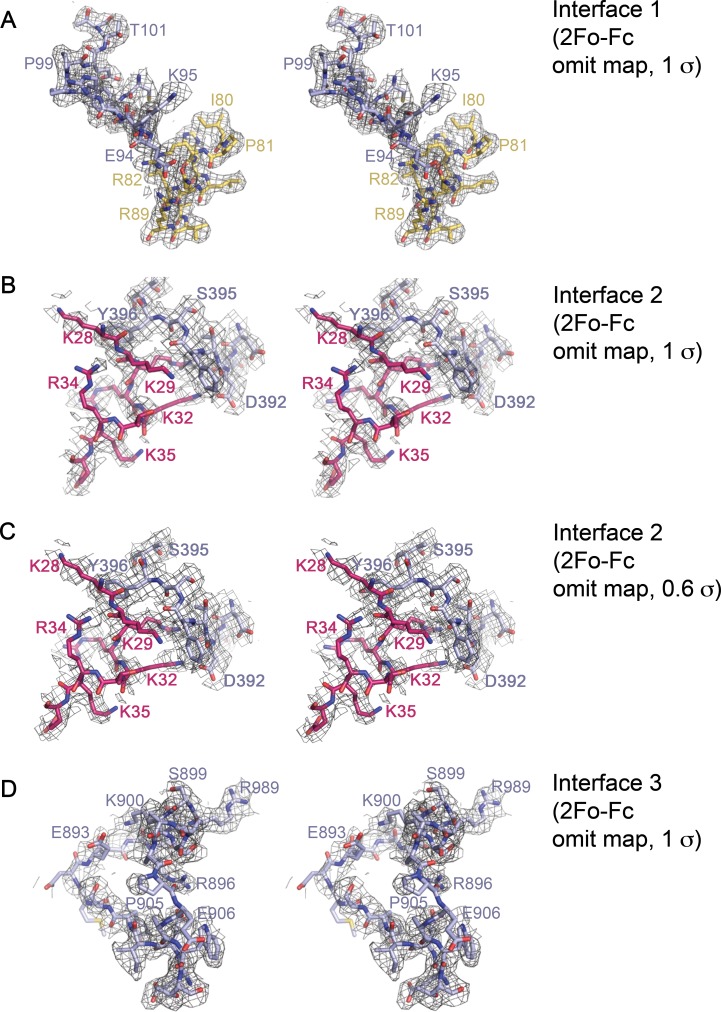
Figure 2—figure supplement 2. Stereo views of representative electron-density within the Imp9•H2A-H2B interfaces.

Figure 2—figure supplement 2.

(A-D) Cross-eyed stereo views of representative 2Fo-Fc omit map electron density within Interface 1 (contoured at 1σ A); residues 90–102 of Imp9 and residues 80–89 of H2B omitted), Interface 2 (contoured at 1σ in B), and contoured at 0.6σ in C); residues 390-397of Imp9 and residues 28–36 of H2B omitted) and Interface 3 (contoured at 1σ D); residues 886–909 on Imp9 omitted).
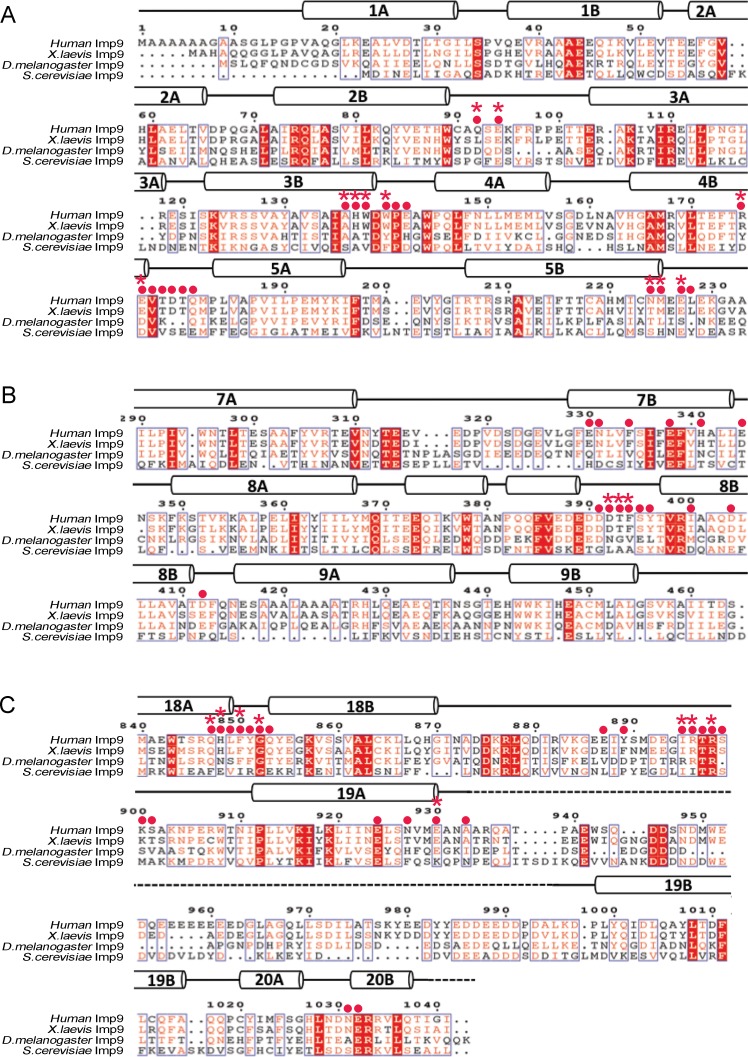
Figure 2—figure supplement 3. Sequence alignment of regions of Imp9 that interact with H2A-H2B.

Figure 2—figure supplement 3.

(A-C) Sequence alignment of Imp9 sequences (human, X. laevis, D. melanogaster and S. cerevisiae) from the region that forms Interface 1 (A), Interface 2 (B) and Interface 3 (C) in Imp9•H2A-H2B structure. Residues in the three interfaces are mostly conserved, with Interface three being the most conserved. The level of conservation is consistent with many Imp9 residues, especially in Interface 1, using their main chain for interactions with histone residues.