. 2019 Apr 8;8:e40260. doi: 10.7554/eLife.40260

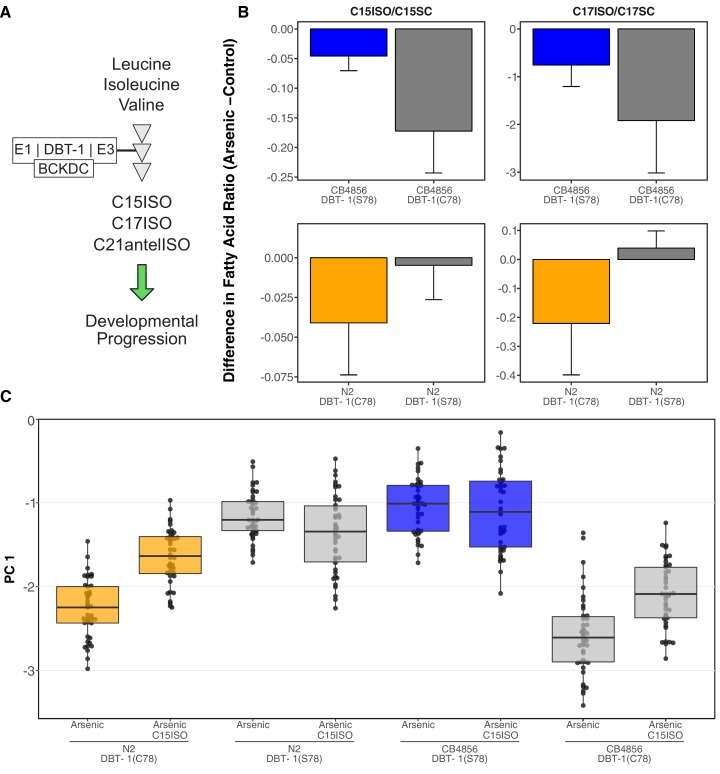
Figure 4. Differential production of mmBCFA underlies DBT-1(C78)-mediated sensitivity to arsenic trioxide.

(A) A simplified model of BCAA catabolism in C. elegans. The BCKDH complex, which consists of DBT-1, catalyzes the irreversible oxidative decarboxylation of branched-chain ketoacids. The products of thesebreakdown can then serve as building blocks for the mmBCFA that are required for developmental progression. (B) The difference in the C15ISO/C15SC (left panel) or C17ISO/C17SC (right panel) ratios between 100 μM arsenic trioxide and control conditions is plotted on the y-axis for three independent replicates of the CB4856 and CB4856 allele replacement strains and six independent replicates of the N2and N2 allele replacement strains. The difference between the C15 ratio for the CB4856-CB4856 allele replacement comparison is significant (Tukey HSD p-value = 0.0427733), but the difference between the C17 ratios for these two strains is not (Tukey HSD p-value = 0.164721). The difference between the C15and C17 ratios for the N2-N2 allele replacement comparisons are both significant (C15: Tukey HSD p-value = 0.0358; C17: Tukey HSD p-value = 0.003747). (C) Tukey box plots median animal length after arsenic trioxide or arsenic trioxide and 0.64 μM C15ISO exposure are shown (N2, orange; CB4856, blue; allele replacement strains, gray). Labels correspond to the genetic background and the corresponding residue at position 78 of DBT-1 (C for cysteine, S for serine). Every pair-wise strain comparison is significant except for the N2 DBT-1(S78) - CB4856 comparisons (Tukey’s HSD p-value < 1.43E-6).

Figure 4—source data 1. Metabolite measurements for the CB4856 and CB4856 allele replacement strains (Used for Figure 4B and Figure 4—figure supplement 13).
DOI: 10.7554/eLife.40260.062
Figure 4—source data 2. Processed metabolite measurements for the CB4856 and CB4856 allele replacement strains (Used for Figure 4B and Figure 4—figure supplement 13).
DOI: 10.7554/eLife.40260.063
Figure 4—source data 3. Metabolite measurements for the N2 and N2 allele replacement strains (Used for Figure 4B and Figure 4—figure supplement 13).
DOI: 10.7554/eLife.40260.064
Figure 4—source data 4. Processed phenotype data for the C15ISO rescue experiment (Used to generate Figure 4C).
DOI: 10.7554/eLife.40260.065

Figure 4.

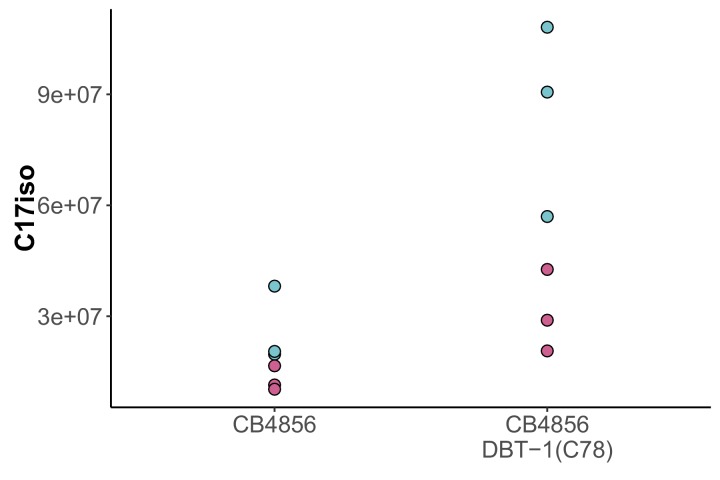
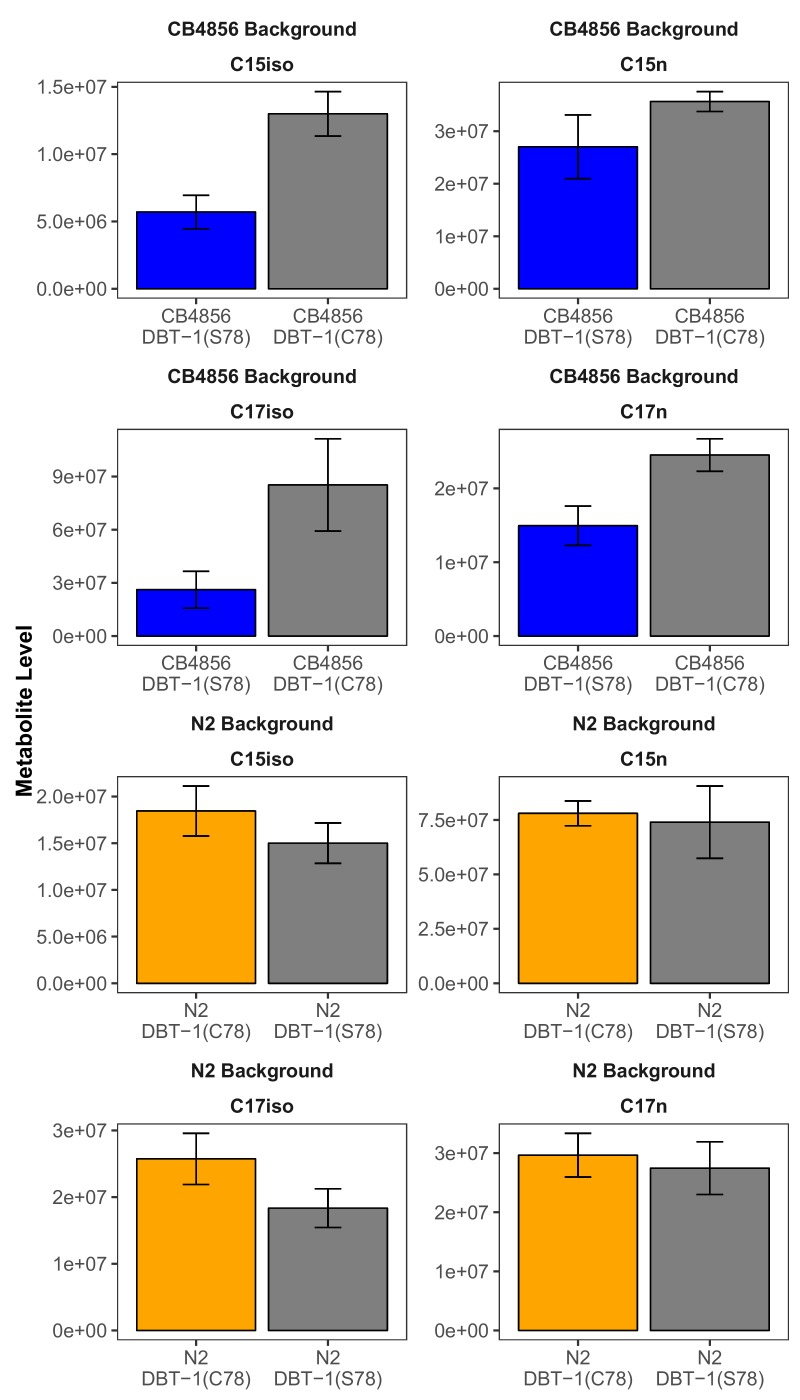
Figure 4—figure supplement 1. Raw abundance of C17ISO for CB4856 and CB4856 allele replacement.

Figure 4—figure supplement 1.

The raw abundance of C17ISO is plotted on the y-axis for three independent replicates of the CB4856 and CB4856 allele replacement strains exposed to control (teal) or 100 µM arsenic trioxide (pink) conditions. The difference between CB4856 replacement mock and arsenic conditions was significant (Tukey HSD p-value=0.029), but the difference between CB4856 mock and arsenic conditions was not significant (Tukey HSD p-value=0.10).
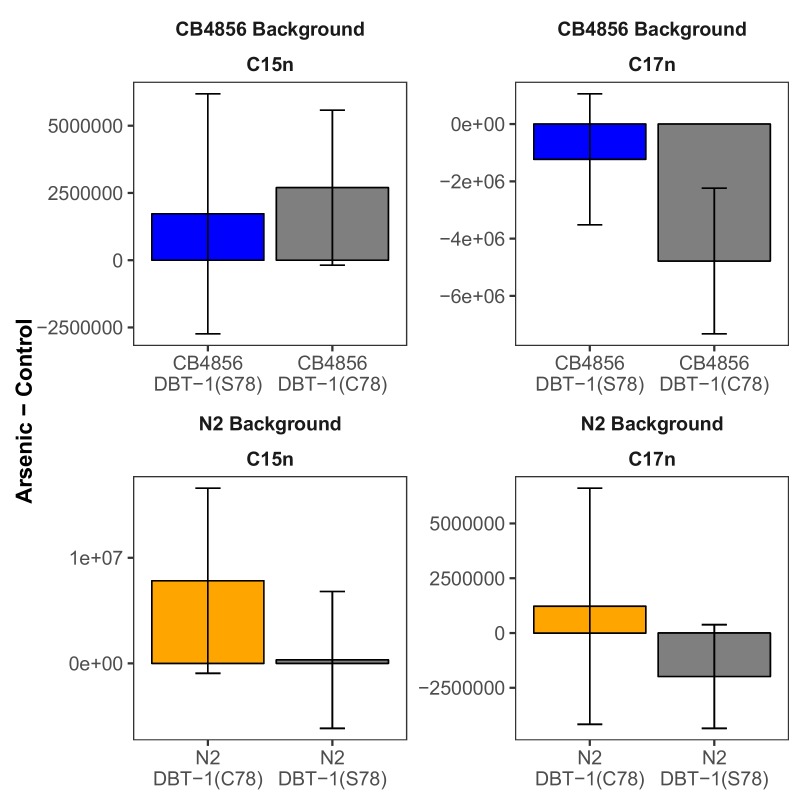
Figure 4—figure supplement 2. Straight-chain fatty acids are not affected by arsenic trioxide.

Figure 4—figure supplement 2.

The difference in raw C15SC (left panel) or C17SC (right panel) abundances between 100 µM arsenic trioxide and control conditions is plotted on the y-axis for three independent replicates of the CB4856 and CB4856 allele replacement strains and six independent replicates of the N2 and N2 allele replacement strains. We found no significant differences when comparing the abundances between parental and allele-replacement strains.
Figure 4—figure supplement 2—source data 1. C15ISO rescue trait loadings of principal components (PCs) for the PCs that explain up to 90% of the total variance in the trait data.
DOI: 10.7554/eLife.40260.052
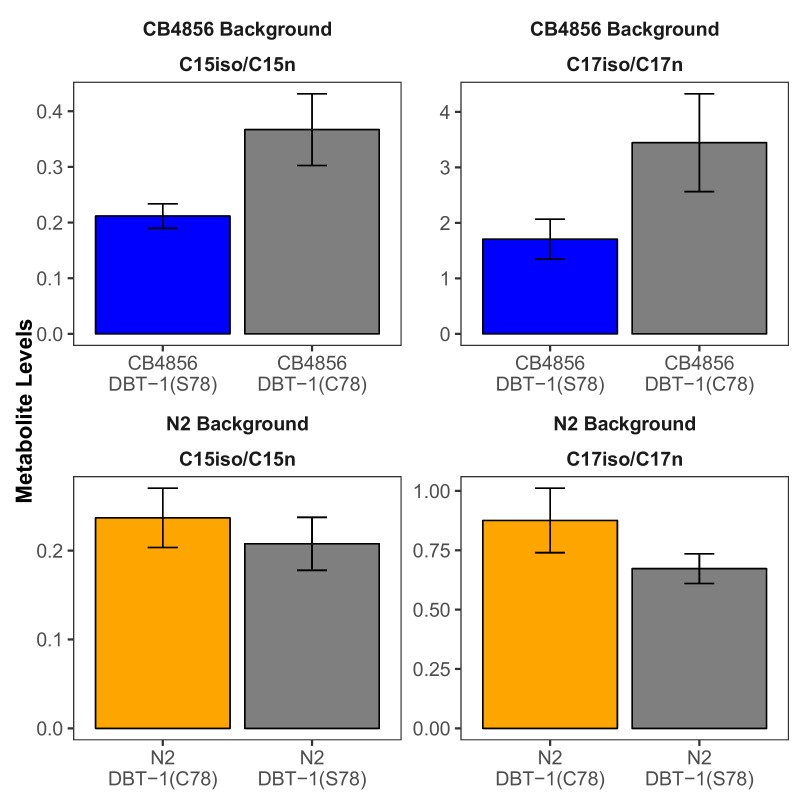
Figure 4—figure supplement 3. C15ISO and C17ISO to strait-chain ratios in control conditions.

Figure 4—figure supplement 3.

The C15ISO/C15SC (left panel) or C17ISO/C17SC (right panel) ratios in control conditions are plotted on the y-axis for three independent replicates of the CB4856 and CB4856 allele replacement strains and six independent replicates of the N2 and N2 allele replacement strains. The C15 and C17 ratios for the CB4856-CB4856 allele replacement comparison were significant (C15: Tukey HSD p-value=0.0168749; C17: Tukey HSD p-value=0.0342525). The difference between the C17 ratio for the N2-N2 allele replacement comparison was significant (Tukey HSD p-value=0.0044667), but the difference in the C15 ratio was not significant (Tukey HSD p-value=0.1239674).
Figure 4—figure supplement 4. Strains with the DBT-1(C78) allele produce more branched chain fatty acids in the L1 larval stage in control conditions.

Figure 4—figure supplement 4.

Branched chain (left panel) and straight chain (right panel) fatty acid measurements in L1 animals arerepresented on the y-axis. We found significant differences in abundances when comparing all parentaland allele-replacement strains for C15ISO and C17ISO chain fatty acids (CB4856-C15ISO DBT-1(C78):Tukey HSD p-value = 0.0036201, n=3; N2-C15ISO DBT-1(C78): Tukey HSD p-value = 0.0265059, n=6;CB4856-C17ISO DBT-1(C78): Tukey HSD p-value = 0.0086572, n=3; N2-C17ISO DBT-1(C78): TukeyHSD p-value = 0.0022501, n=6). Conversely, we observed no significant differences in straight chain fattyproduction except for C17n production in the CB4856 background (CB4856-C15n DBT-1(C78): TukeyHSD p-value = 0.0787388, n=3; N2-C15n DBT-1(C78): Tukey HSD p-value = 0.5817993, n=6; CB4856-C17n DBT-1(C78): Tukey HSD p-value = 0.0086572, n=3; N2-C17n DBT-1(C78): Tukey HSD p-value =0.35827, n=6).
Figure 4—figure supplement 4—source data 1. Metabolite measurements for N2, CB4856, and both allele-replacement strains at the L4 larval stage.
(Used to generate Figure 4—figure supplement 4).
DOI: 10.7554/eLife.40260.055
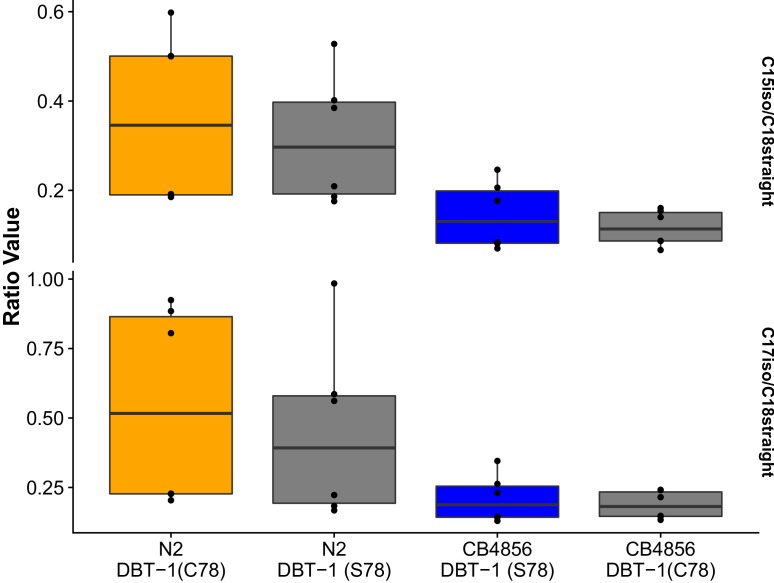
Figure 4—figure supplement 5. Young adult C15ISO and C17ISO to strait-chain ratios in control conditions.

Figure 4—figure supplement 5.

The C15ISO/C18SC (top panel) or C17ISO/C18SC(bottom panel) ratios of young adult animals in control conditions are plotted on the y-axis for six independent replicates for all strains. We found no significant differences when comparing the abundances between parental and allele-replacement strains.
Figure 4—figure supplement 5—source data 1. Trait correlations for the for the C15ISO rescue experiment (Used to generate Figure 4—figure supplement 5).
DOI: 10.7554/eLife.40260.057
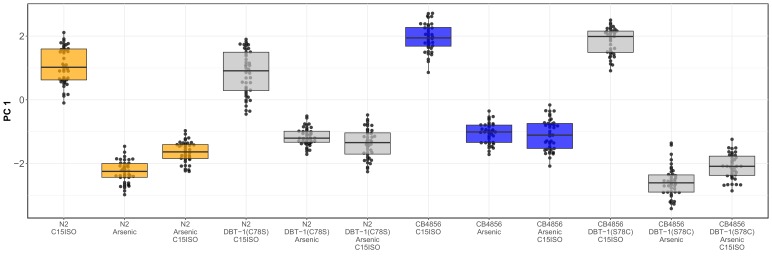
Figure 4—figure supplement 6. Complete results from C15iso rescue experiment.Tukey box plots for the PC1 trait after 0.64 µM C15ISO, arsenic trioxide, or arsenic trioxide and 0.64 µM C15ISO exposure are shown (N2, orange; CB4856, blue; allele replacement strains, gray).

Figure 4—figure supplement 6.

Labels correspond to the genetic background and the corresponding residue at position 78 of DBT-1 (C for cysteine, S for serine). Every pairwise strain comparison was significant except for the N2 DBT-1(S78) - CB4856 comparisons (Tukey’s HSD p-value<1.43E-6).
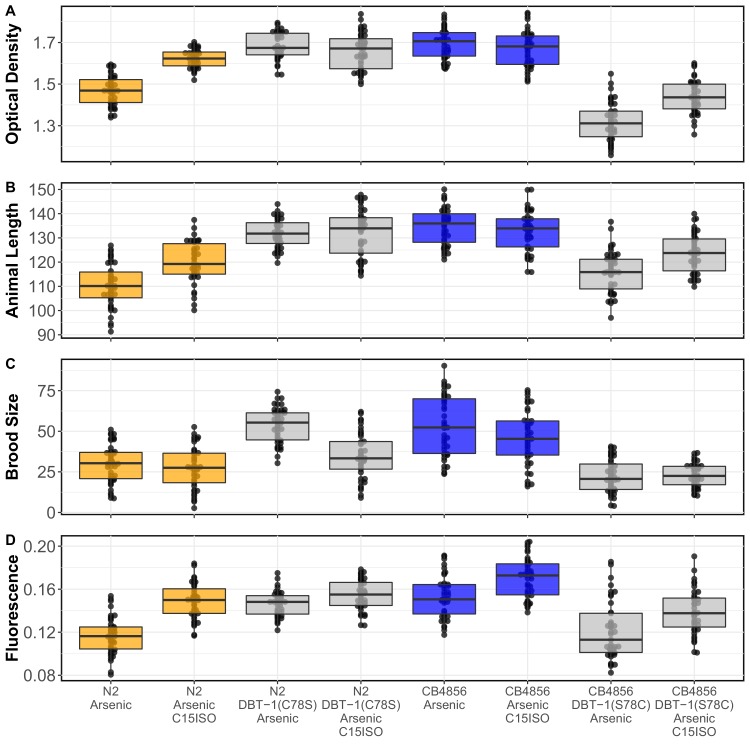
Figure 4—figure supplement 7. BIOSORT-quantified traits for C15ISO rescue experiment Tukey box plots for the mean normalized optical density.

Figure 4—figure supplement 7.

(A), mean animal length (B), brood size (C), and mean normalized yellow fluorescence (D) traits after 0.64 µM C15ISO, arsenic trioxide, or arsenic trioxide and 0.64 µM C15ISO exposure are shown (N2, orange; CB4856, blue; allele replacement strains, gray). Labels correspond to the genetic background and the corresponding residue at position 78 of DBT-1 (C for cysteine, S for serine). For all traits, except brood size, the comparison between arsenic and arsenic with C15ISO for strains with the DBT-1(C78) allele was significant (Tukey’s HSD p-value<2E-3).
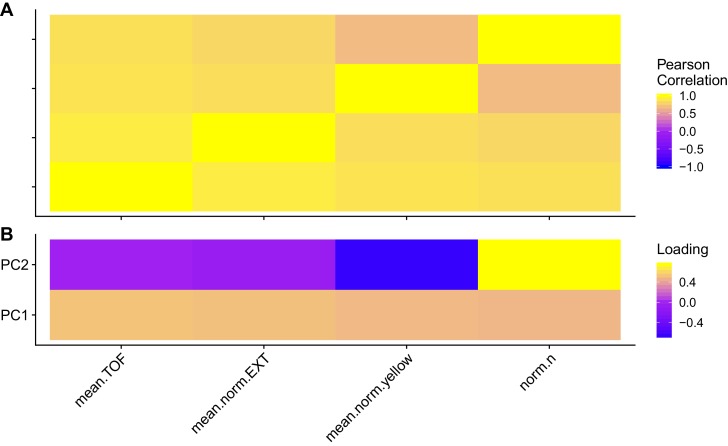
Figure 4—figure supplement 8. Trait correlations and principal component loadings of C15ISO rescue experiment.

Figure 4—figure supplement 8.

(A) The Pearson’s correlation coefficients of the assay- and control-regressed measured traits are shown. (B) The contribution of each measured trait to the principal components that explain 90% of the total variance in the GWA mapping experiment, which was performed at 1000 µM, is shown. For each plot, the tile colors represent the value, where yellow colors represent higher values.
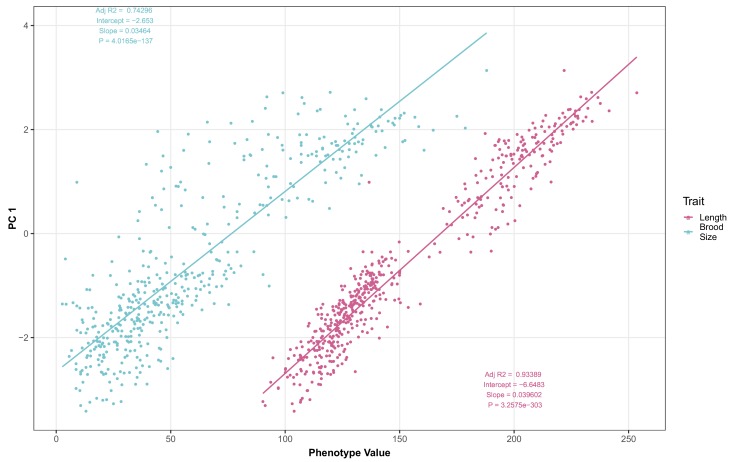
Figure 4—figure supplement 9. Brood size and animal length are correlated with the first principal component for the C15ISO rescue experiment.

Figure 4—figure supplement 9.

The correlations between brood size (blue) or animal length (pink) with the first principal component trait for the C15ISO rescue experiment are shown. Each dot represents an individual allele-replacement or parental strain replicate phenotype, with the animal length and brood size phenotype values on the x-axis and the first principal component phenotype on the y-axis.