. 2019 Apr 8;8:e40260. doi: 10.7554/eLife.40260

Figure 5. Protective effect of cysteine residues in human DBT1.

(A) Alignment of C. elegans DBT-1 and H. sapiens DBT1. The residues tested for an arsenic-specific effect are indicated with arrows - W84C (pink), S112C (blue), and R113C (black). The lysine that is post-translationally modified with a lipoid acid is highlighted in red. (B) The percent increase of edited human cells that contain the W84C, S112C, or R113C amino acid change in DBT1 in the presence 5 µM arsenic trioxide relative to control conditions are shown. The number of reads in 5 µM arsenic trioxide for all replicates are significantly different from control conditions (Fisher’s exact test, p-value<0.011).

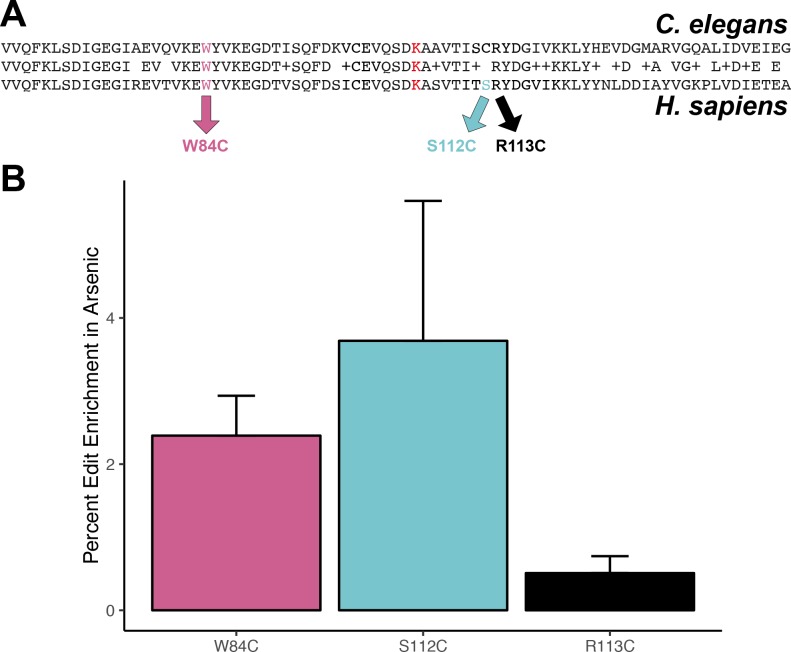
Figure 5—source data 1. Human cell line read data for CRISPR replacement experiment in 293 T cells.
(Used to generate Figure 5B).
DOI: 10.7554/eLife.40260.069
Figure 5—source data 2. Results from Fisher’s exact test of human cell line read data for CRISPR replacement experiment in 293 T cells.
DOI: 10.7554/eLife.40260.070
Figure 5—source data 3. Metabolite measurements from human cell line experiments.
DOI: 10.7554/eLife.40260.071

Figure 5.

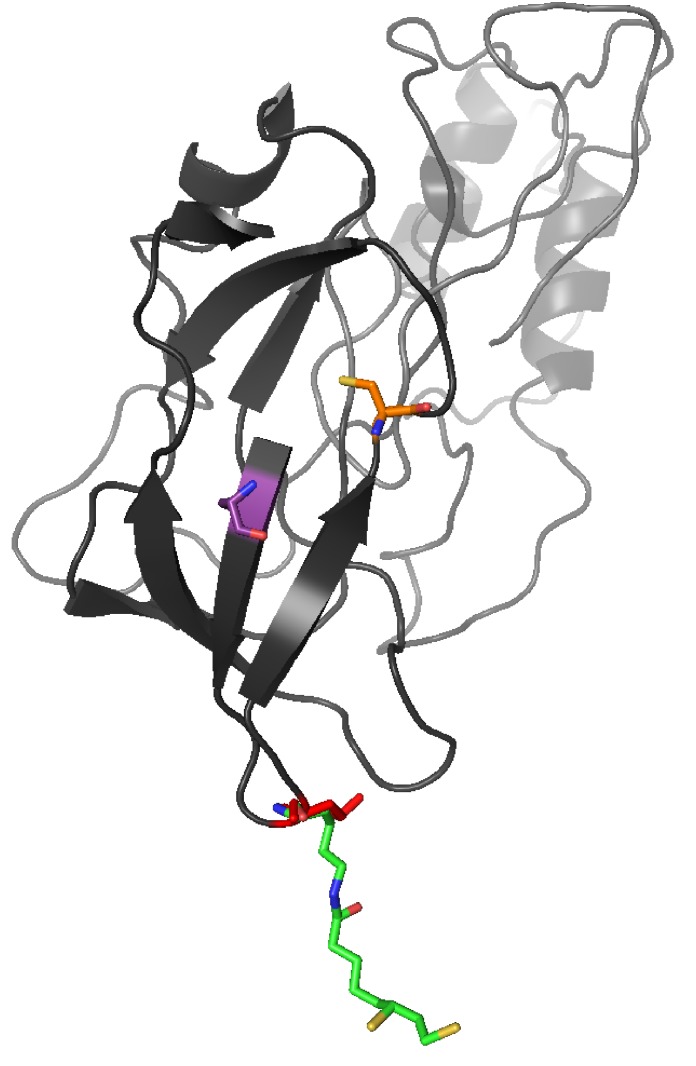
Figure 5—figure supplement 1. Three-dimensional homology model of C. elegans DBT-1 A three-dimensional homology model of C. elegans DBT-1 (black) aligned to human pyruvate dehydrogenase lipoyl domain (PDB:1Y8N) is shown.

Figure 5—figure supplement 1.

The C78 residue that conferred resistance to arsenic trioxide is highlighted in orange, and the C65 residue is highlighted in purple. The C. elegans K71 residue is highlighted in red, and the human lipoylated lysine is highlighted in green.
Figure 5—figure supplement 1—source data 1. Tajima’s D of GWA mapping confidence interval.
(Used to generate Figure 5—figure supplement 1).
DOI: 10.7554/eLife.40260.068