

Abstract
OBJECTIVES:
Digestive diseases account for over 100 million ambulatory care visits annually in the U.S. Yet, comparatively less is known about the true burden of gastrointestinal (GI) symptoms in the general U.S. population. The aim of this study was to use data from the “National GI Survey” – a population-based audit of GI symptoms in over 71,000 participants – to determine the prevalence and predictors of GI symptoms in community-dwelling Americans.
METHODS:
We conducted the National GI Survey using a mobile app called MyGiHealth which employs a computer algorithm that systematically collects participants’ GI symptoms. We recruited a nationally representative sample of Americans to complete the survey, which guided respondents through National Institutes of Health (NIH) GI Patient Reported Outcome Measurement Information System (PROMIS®) scales along with questions about relevant comorbidities and demographics. We measured the prevalence of GI symptoms in the past week and employed logistic regression to adjust for confounding.
RESULTS:
Overall, 71,812 individuals completed the survey, of which 61% reported having had ≥1 GI symptom in the past week. The most commonly reported symptoms were heartburn/reflux (30.9%), abdominal pain (24.8%), bloating (20.6%), diarrhea (20.2%), and constipation (19.7%). Less common symptoms were nausea/vomiting (9.5%), dysphagia (5.8%), and bowel incontinence (4.8%). Females, non-Hispanic whites, and individuals who were younger, highly educated, and had medical comorbidities were more likely to have symptoms (all adjusted p<.05).
CONCLUSIONS:
In this large population-based study that combined digital health technology with NIH PROMIS questionnaires, we found that GI symptoms are highly prevalent, as nearly two-thirds of surveyed Americans are burdened by these symptoms.
INTRODUCTION
The burden of gastrointestinal (GI), liver, and pancreatic diseases in the U.S. is staggering, as they are substantial sources of morbidity, mortality, and cost.(1, 2) Each year, these conditions account for 105 million ambulatory care visits, 14 million hospital admissions, 236,000 deaths, and $142 billion in total costs.(1) With an aging population, the prevalence of digestive diseases is expected to grow over time.(2)
While there have been a number of epidemiological studies that have examined the prevalence of digestive diseases and symptoms in the U.S., these have largely focused on disease data from those seeking healthcare in the ambulatory and inpatient settings (1–8) or centered on a limited set of GI symptoms (i.e., only upper or lower).(9–15) Comparatively less work has focused on the prevalence of both upper and lower GI symptoms in the community setting, including abdominal pain, bloat/gas, bowel incontinence, constipation, diarrhea, disrupted swallowing, heartburn/reflux, and nausea/vomiting. This distinction is important, because patients must first present to a healthcare provider for evaluation of GI symptoms before specific diagnoses can be made. In other words, symptoms often precipitate care seeking and may serve as the point of entry into the healthcare system. Therefore, measuring the prevalence of digestive diseases without assessing the prevalence of underlying symptoms in the community at large fails to capture the overall burden of illness.
Moreover, there is a substantial proportion of Americans who regularly experience GI symptoms, but do not seek care from a clinician. Less than 20% of individuals with abdominal pain, bloating, or diarrhea consult a healthcare provider for evaluation and management of their symptoms.(14) Therefore, prior epidemiological studies that focused on digestive diseases and healthcare utilization data may underestimate the true burden of GI symptoms among the general population. To address this gap in knowledge, we aimed to use data from the “National GI Survey” – a population-based audit of GI symptoms in over 71,000 Americans – to determine the distribution and predictors of GI symptoms in community-dwelling Americans.
METHODS
Study Design, Data Source, and Study Population
We performed a retrospective cross-sectional study using data from the National GI Survey (16–18), a population-based survey that aimed to determine the prevalence and distribution of GI symptoms in community-dwelling Americans. This study was approved by the Cedars-Sinai Institutional Review Board (Pro41586).
The National GI Survey was based on MyGiHealth (https://mygi.health), a mobile app that uses a computer algorithm to systematically collect GI symptom information. When participants first logged on to the survey, they were asked to “Select any symptom(s) you experienced in the past week” and answer options included the following: (i) abdominal pain; (ii) bloat/gas; (iii) bowel incontinence; (iv) constipation; (v) diarrhea; (vi) disrupted swallowing; (vii) heartburn/reflux; (viii) nausea/vomiting; and (ix) none of the above. These symptoms are based on the National Institutes of Health (NIH) Patient Reported Outcome Measurement Information System (PROMIS®) framework of GI symptoms, which we previously developed and validated using data from over 2000 subjects.(19–21) For each reported symptom, respondents were then guided through the corresponding GI PROMIS questionnaires (refer to www.healthmeasures.net for actual item banks).(22) Participants were also presented additional demographic, socioeconomic status, and medical comorbidity questions.
The National GI Survey was conducted from October 14, 2015 to November 4, 2015. To recruit a representative sample of Americans who were 18 years of age or older, we partnered with Cint® (www.cint.com), a survey research firm. Cint partners with panel companies and research panels across the U.S. and all together has access to over 10 million potential research participants. We used quotas for age, sex, and region of the country (Northeast, South, Midwest, and West) to support recruitment of a population-based sample. With respect to U.S. region, the following quotas were used: Northeast – 19%, South – 36%, Midwest – 23%, and West – 22%; Supplementary Table 1 lists the individual states within each U.S. region.
Panelists who met U.S. quota criteria for age, sex, and region of the country were sent an email through Cint research panels inviting them to complete an online survey. The email included a link to the survey along with the following templated text, which was subject to editing from individual research panels: “Based on the information stored in your [research panel] profile, we believe we have a survey that you will qualify & earn from. The survey takes approximately 15 minutes and if you successfully complete it, your account will be credited with [incentive].” Users who clicked the link were then brought to the survey home page which asked them to complete a “GI Survey.”
The Cint platform utilizes a reward system based on marketplace points. The number of points awarded is predetermined by Cint and is based on the anticipated length of the survey and not on the actual amount of time respondents spend on the questions. In other words, respondents do not earn more points by artificially extending the survey and answering more questions. On reaching a certain redemption level, panelists can redeem their rewards through different online payment partners linked to Cint. The size of the redemption is based on the number of points earned. Panelists can choose to receive their rewards in cash sent to their bank accounts or they can shop online with participating merchants or make payments to a charity. Incentive levels have been set to encourage long-term participation and to discourage professional respondents who seek to take surveys only to obtain payment.
Outcomes
Our primary outcome was prevalence of at least one of the following GI PROMIS symptoms in the past week: (i) abdominal pain; (ii) bloat/gas; (iii) bowel incontinence; (iv) constipation; (v) diarrhea; (vi) disrupted swallowing; (vii) heartburn/reflux; (viii) nausea/vomiting. Among those who reported experiencing a GI symptom in the past seven days, we also examined prevalence of overlapping symptoms (i.e., two or more co-occurring symptoms) as our secondary outcome.
Covariates
We identified demographic, socioeconomic status, and medical comorbidity data that may have influenced prevalence of GI symptoms. Demographic variables included age, gender, race/ethnicity, and marital status. Socioeconomic status variables included highest level of educational attainment, employment status, and total household income. All individuals were also asked to identify whether they had been diagnosed by a physician with any of the following comorbid conditions that affect the GI tract: cancer of the digestive system, celiac disease, cirrhosis, chronic constipation, Crohn’s disease, diabetes, endometriosis, gallstones, gastroesophageal reflux disease, HIV/AIDS, irritable bowel syndrome, pancreatitis, peptic ulcer disease, thyroid disease, and ulcerative colitis.
Statistical Analyses
All statistical analyses were performed in Stata 13.1 (StataCorp LP, College Station, TX). We used post-stratification to adjust for over- and under-sampling of subgroups in the National GI Survey; this decreases bias due to nonresponse and underrepresented groups in the population.(23, 24) Specifically, population weights based on latest U.S. Census data for age, sex, and race/ethnicity were applied to the sample data in order to produce population estimates (Supplementary Table 2).(25, 26)
A two-tailed p-value of less than .05 was considered statistically significant. In bivariate analyses, categorical variables were compared using the chi-squared test. For multivariable analyses, we performed population-weighted (PW) logistic regression models to adjust for potential confounding factors and to calculate odds ratios (OR) and 95% confidence intervals (CI).(23, 24) These regression models were performed on our primary (prevalence of ≥1 GI symptom in past week) and secondary outcomes (prevalence of overlapping GI symptoms [i.e., two or more co-occurring symptoms] in past week), adjusted by all demographic, socioeconomic, and self-reported medical comorbidity variables described above. We also performed the above analyses among the subgroup of individuals who did not report any physician-diagnosed medical comorbidities.
RESULTS
Study Population
Over 1.3 million individuals were invited to complete the National GI Survey, among whom 124,674 (9.4%) accessed the survey. Of those who accessed the survey, 71,812 (57.6%) completed the survey and were included in the analytic sample. Demographics for the study cohort are listed in Table 1.
TABLE 1.
Demographics of the study population (N=71,812).
| Variable | n | Actual % | Population- weighted % * |
|---|---|---|---|
| Age: | |||
| 18-24 y | 12,419 | 17.3% | 14.0% |
| 25-44 y | 37,055 | 51.6% | 40.0% |
| 45-64 y | 20,468 | 28.5% | 30.0% |
| ≥65 y | 1870 | 2.6% | 16.0% |
| Gender: | |||
| Female | 42,696 | 59.5% | 51.0% |
| Male | 29,116 | 40.5% | 49.0% |
| Race/ethnicity: | |||
| Non-Hispanic whites | 50,943 | 70.9% | 62.0% |
| Non-Hispanic blacks | 6353 | 8.9% | 12.0% |
| Latinos | 8255 | 11.5% | 18.0% |
| Asians | 3914 | 5.5% | 6.0% |
| Other | 2347 | 3.3% | 2.0% |
| Education level: | |||
| Did not graduate high school | 2862 | 4.0% | 4.2% |
| High school graduate | 15,295 | 21.3% | 21.5% |
| Some college | 22,282 | 31.0% | 30.9% |
| College graduate | 24,020 | 33.5% | 32.7% |
| Graduate degree | 7353 | 10.2% | 10.7% |
| Marital status: | |||
| Single | 19,120 | 26.6% | 24.5% |
| Divorced, separated, or widowed | 8592 | 12.0% | 16.1% |
| Married or in a long-term relationship | 44,100 | 61.4% | 59.4% |
| Employment status: | |||
| Unemployed | 24,680 | 34.4% | 40.3% |
| Employed or full-time student | 47,132 | 65.6% | 59.7% |
| Total household income: | |||
| $0 to 50,000 | 35,725 | 49.8% | 50.0% |
| $50,001 to 100,000 | 22,226 | 31.0% | 30.7% |
| $100,001 to 200,000 | 7582 | 10.6% | 10.3% |
| ≥$200,001 | 1110 | 1.6% | 1.7% |
| Prefer not to say | 5169 | 7.2% | 7.4% |
| Num. of medical comorbidities: | |||
| 0 | 52,243 | 72.8% | 70.7% |
| 1 | 13,835 | 19.3% | 20.4% |
| 2 | 3938 | 5.5% | 6.1% |
| ≥3 | 1796 | 2.5% | 2.8% |
Prevalence and Predictors of Having ≥1 GI Symptom in Past Week
Among the 71,812 respondents, 45,498 (PW 61.0%) reported experiencing at least one GI symptom within the past week. Symptomatic participants reported the following number of symptoms: 1 symptom – 17,045 (PW 40.6%); 2 – 11,516 (PW 24.9%); 3 – 8070 (PW 16.7%); 4 – 4911 (PW 10.2%); 5 – 2426 (PW 4.5%); 6 – 1065 (PW 2.2%); 7 – 338 (PW 0.7%); 8 – 127 (PW 0.3%).
Figure 1 depicts the prevalence of the individual symptoms. The most common symptom was heartburn/reflux, with nearly one-third having experienced it in the past seven days. We found that nearly a quarter of Americans had recent abdominal pain. Bloating, diarrhea, and constipation were also common, as one-fifth of survey respondents experienced these symptoms within the past week. Conversely, nausea/vomiting, dysphagia, and bowel incontinence were less common. In Supplementary Table 3, we show the percentile scores crosswalk table for the eight individual GI PROMIS scales among symptomatic individuals.
FIGURE 1.
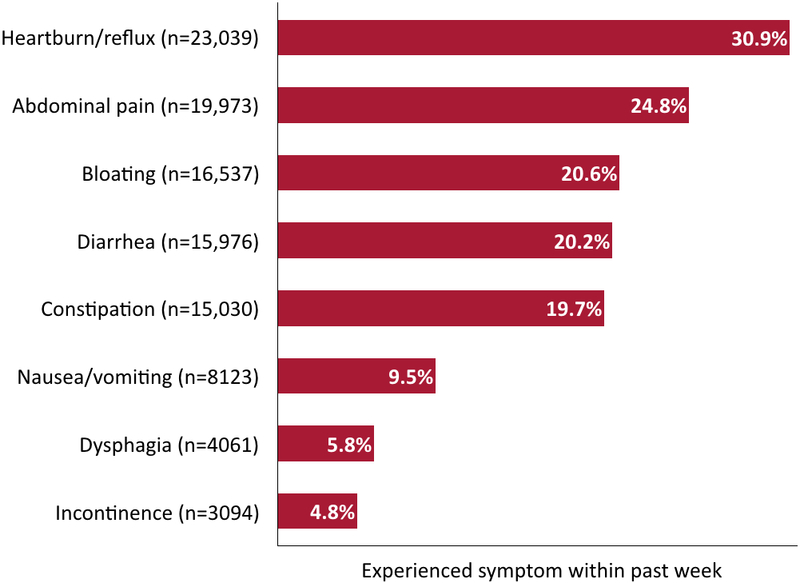
Prevalence of individual GI symptoms within the past week (N=71,812). Note: data are presented as population-weighted %.
Table 2 presents ORs from the PW multivariable logistic regression on presence of ≥1 GI symptom in the last seven days. Increasing age was associated with decreased odds for having had symptoms. Males as well as non-Hispanic blacks and Asians were also less likely to report recent GI symptoms. On the other hand, higher educational attainment, married or prior married status, employed status, and increasing number of medical comorbidities were all associated with significantly higher odds for reporting ≥1 GI symptom in the past week.
TABLE 2.
Predictors of having experienced ≥1 GI symptom in past week (N=71,812).
| Variable | Had ≥1 GI symptom in past week |
OR [95% CI] * |
|---|---|---|
| Age: | ||
| 18 to 24y | 6954 (54.6%) | reference |
| 25 to 44y | 24,690 (65.4%) | 1.20 [1.14-1.26] |
| 45 to 64y | 12,811 (61.3%) | 0.84 [0.78-0.89] |
| ≥65y | 1043 (55.1%) | 0.63 [0.54-0.73] |
| Gender: | ||
| Female | 28,804 (65.0%) | reference |
| Male | 16,694 (56.9%) | 0.74 [0.70-0.79] |
| Race/ethnicity: | ||
| Non-Hispanic white | 33,321 (63.1%) | reference |
| Non-Hispanic black | 3389 (51.2%) | 0.69 [0.63-0.75] |
| Latino | 5236 (64.2%) | 1.09 [0.97-1.22] |
| Asian | 2106 (49.9%) | 0.65 [0.57-0.74] |
| Other | 1446 (60.2%) | 0.96 [0.84-1.09] |
| Education level: | ||
| Did not graduate from high school | 1397 (45.4%) | reference |
| High school degree | 8953 (57.1%) | 1.40 [1.17-1.67] |
| Some college | 14,402 (61.9%) | 1.61 [1.35-1.92] |
| College degree | 16,009 (65.1%) | 1.77 [1.48-2.11] |
| Graduate degree | 4737 (60.1%) | 1.43 [1.18-1.73] |
| Marital status: | ||
| Never married | 10,507 (53.6%) | reference |
| Divorced, separated, or widowed | 5502 (60.8%) | 1.27 [1.13-1.43] |
| Married or in a long-term relationship | 29,489 (64.1%) | 1.30 [1.22-1.37] |
| Employment status: | ||
| Not employed | 15,577 (59.3%) | reference |
| Employed or full-time student | 29,921 (62.2%) | 1.09 [1.02-1.16] |
| Total household income, $: | ||
| 0 to 50,000 | 22,378 (60.2%) | reference |
| 50,001 to 100,000 | 15,147 (66.0%) | 1.18 [1.10-1.26] |
| 100,001 to 200,000 | 5122 (65.4%) | 1.13 [1.04-1.23] |
| ≥200,001 | 662 (61.5%) | 1.13 [0.88-1.44] |
| Prefer not to say | 2189 (40.7%) | 0.51 [0.45-0.58] |
| Num. of medical comorbidities: | ||
| 0 | 29,527 (54.0%) | reference |
| 1 | 10,863 (74.5%) | 2.57 [2.36-2.79] |
| 2 | 3434 (84.2%) | 4.85 [4.08-5.75] |
| ≥3 | 1674 (88.5%) | 7.11 [4.30-11.75] |
Data are presented as n (population-weighted %).
The population-weighted logistic regression model adjusted for all covariates in the table.
Subgroup Analysis Among Individuals Without Comorbidities
Among the 52,243 individuals who did not report having a physician-diagnosed medical comorbidity, we found that 29,527 (PW 54.0%) experienced at least 1 GI symptom within the past week, and Supplementary Table 4 presents results from the PW multivariable logistic regression. Findings among the subgroup were largely similar to the primary analyses. Older individuals, males, non-Hispanic blacks, and Asians all had lower odds for reporting GI symptoms within the past week. Conversely, those who had more education, were married or previously married, and employed were more likely to have experienced recent symptoms.
Prevalence and Predictors of Overlapping GI Symptoms
Of the 45,498 symptomatic respondents, we found that 28,453 (PW 58.4%) reported concomitant symptoms (i.e., two or more GI symptoms in the past week). Table 3 presents the predictors of overlapping symptoms. Similar to the GI symptom prevalence analyses, those who were older, male, non-Hispanic black, Latino, and Asian were significantly less likely to have concurrent symptoms. On the other hand, higher education level, married status, and increasing number of medical comorbidities were associated with a greater burden of GI symptoms.
TABLE 3.
Predictors of concomitant GI symptoms among symptomatic individuals (n=45,498).
| Variable | Has concomitant GI symptoms * |
OR [95% CI] † |
|---|---|---|
| Age: | ||
| 18 to 24y | 4382 (59.7%) | reference |
| 25 to 44y | 15,748 (61.3%) | 1.01 [0.94-1.08] |
| 45 to 64y | 7742 (58.5%) | 0.83 [0.76-0.90] |
| ≥65y | 581 (49.9%) | 0.58 [0.47-0.73] |
| Gender: | ||
| Female | 19,454 (64.3%) | reference |
| Male | 8,999 (52.3%) | 0.62 [0.58-0.67] |
| Race/ethnicity: | ||
| Non-Hispanic white | 21,510 (61.6%) | reference |
| Non-Hispanic black | 1771 (48.3%) | 0.60 [0.54-0.68] |
| Latino | 3164 (56.8%) | 0.83 [0.73-0.96] |
| Asian | 1076 (49.0%) | 0.66 [0.53-0.81] |
| Other | 932 (62.2%) | 1.04 [0.88-1.23] |
| Education level: | ||
| Did not graduate from high school | 749 (49.3%) | reference |
| High school degree | 5482 (57.2%) | 1.28 [1.02-1.62] |
| Some college | 9414 (61.6%) | 1.49 [1.18-1.87] |
| College degree | 9977 (57.9%) | 1.30 [1.02-1.65] |
| Graduate degree | 2831 (56.0%) | 1.24 [0.97-1.58] |
| Marital status: | ||
| Never married | 6281 (56.6%) | reference |
| Divorced, separated, or widowed | 3392 (54.8%) | 0.93 [0.80-1.08] |
| Married or in a long-term relationship | 18,780 (60.1%) | 1.07 [1.00-1.16] |
| Employment status: | ||
| Not employed | 9921 (57.2%) | reference |
| Employed or full-time student | 18,532 (59.2%) | 1.08 [0.99-1.19] |
| Total household income, $: | ||
| 0 to 50,000 | 14,190 (58.9%) | reference |
| 50,001 to 100,000 | 9595 (59.7%) | 1.01 [0.93-1.11] |
| 100,001 to 200,000 | 3087 (58.1%) | 0.94 [0.84-1.06] |
| ≥200,001 | 385 (50.3%) | 0.83 [0.66-1.05] |
| Prefer not to say | 1196 (48.7%) | 0.67 [0.55-0.81] |
| Num. of medical comorbidities: | ||
| 0 | 17,242 (54.8%) | reference |
| 1 | 7112 (59.4%) | 1.28 [1.17-1.39] |
| 2 | 2645 (70.3%) | 2.14 [1.76-2.61] |
| ≥3 | 1454 (85.3%) | 5.07 [4.04-6.36] |
Data are presented n (population-weighted %).
Reported at least two GI symptoms within past week.
The population-weighted logistic regression model adjusted for all covariates in the table.
In Table 4, we depict the overall prevalence of specific GI symptom combinations among the full study cohort. Heartburn/reflux commonly co-occurred with abdominal pain (PW 12.3%), bloat/gas (PW 10.2%), constipation (PW 9.2%), and diarrhea (PW 9.2%). Individuals with abdominal pain also frequently reported bloat/gas (PW 11.6%), diarrhea (PW 10.0%), and constipation (PW 9.5%). Figure 2 presents the prevalence of concomitant symptoms among symptomatic respondents, stratified by individual GI symptoms.
TABLE 4.
Prevalence of co-occurring GI symptom combinations among entire study cohort (N=71,812).
| GI symptom | Bloat/gas | Bowel incontinence |
Constipation | Diarrhea | Disrupted swallowing |
Heartburn/ reflux |
Nausea/ Vomiting |
|---|---|---|---|---|---|---|---|
| Abdominal pain | 9778 (11.6%) |
1831 (2.6%) |
7819 (9.5%) |
8434 (10.0%) |
2090 (2.8%) |
9888 (12.3%) |
4974 (5.6%) |
| Bloat/gas | --- | 1396 (1.9%) |
7046 (8.6%) |
6379 (7.5%) |
1642 (2.2%) |
8124 (10.2%) |
3737 (4.3%) |
| Bowel incontinence | --- | --- | 1169 (1.6%) |
1888 (2.6%) |
539 (0.8%) |
1506 (2.3%) |
838 (1.1%) |
| Constipation | --- | --- | --- | 4819 (5.8%) |
1467 (2.0%) |
7125 (9.2%) |
3076 (3.6%) |
| Diarrhea | --- | --- | --- | --- | 1479 (1.9%) |
7417 (9.2%) |
3849 (4.4%) |
| Disrupted swallowing | --- | --- | --- | --- | --- | 2241 (3.1%) |
1201 (1.6%) |
| Heartburn/reflux | --- | --- | --- | --- | --- | --- | 4329 (5.0%) |
Data are presented as n (population-weighted %).
FIGURE 2.

Prevalence of overlapping symptoms among symptomatic respondents (n=45,498), stratified by individual GI symptoms. Note: data are presented as population-weighted %.
Subgroup Analysis Among Individuals Without Comorbidities
There were 29,527 respondents who were symptomatic and did not have any reported medical comorbidities. Among this group, we noted that 17,242 (PW 55.1%) had ≥2 GI symptoms in the past week and Supplementary Table 5 presents predictors of overlapping symptoms. Just as in the primary analyses, we found that older individuals, males, non-Hispanic blacks, and Asians were significantly less likely to have concurrent symptoms. Married and employed individuals had higher odds for reporting multiple symptoms. Conversely, in contradiction to the main analyses, the association between education level and overlapping symptoms was generally no longer significant.
DISCUSSION
In this large population-based study, we found that GI symptoms are very common with almost two-thirds of surveyed Americans reporting some degree of symptom burden. There was an uneven distribution in GI symptoms, as females, non-Hispanic whites, higher-educated individuals, and those with medical comorbidities were significantly more likely to report symptoms.
Our study has a number of significant strengths. One such strength is its focus on the prevalence of GI symptoms in the general U.S. population rather than among healthcare-seeking patients. While there have been many prior epidemiological studies focused on examining the prevalence of GI diagnoses made in the ambulatory and inpatient settings (1–8), it remains important to know about the distribution of GI symptoms in the community. Prior to receiving any diagnoses from healthcare providers, individuals first experience symptoms, which may then prompt care seeking. Another strength is use of a novel online digital health tool that employed validated NIH PROMIS questionnaires and computerized adaptive testing to systematically gather comprehensive GI symptom information from respondents.(21, 27, 28) This allowed us to efficiently gather data from a very large cross-section of the general U.S. population; we recruited over 71,000 respondents in the span of three weeks. Moreover, leveraging an online platform is less resource intensive compared to other population-based surveys that require significant investments in infrastructure and personnel to conduct household and telephone interviews.(9, 13–15, 29, 30) This approach is also in line with a recommendation from the National Academy of Medicine (formerly called the Institute of Medicine) to use digital technologies to decrease the burden of data collection as one of many key strategies for transforming the healthcare delivery system and population health.(31) Finally, employing digital health tools to collect population-based data in gastroenterology, hepatology, and other areas of medicine will continue to become easier to implement as use of the Internet is nearing saturation.(32, 33)
The finding that GI symptoms are highly prevalent in the U.S. is consistent with prior population-based studies conducted among community-dwelling Americans. For example, a 1993 U.S. householder survey by Drossman and colleagues found that among 5430 individuals, 69% reported at least one functional GI syndrome over the past three months.(9) The US Upper Gastrointestinal Study by Camilleri et al., which included a representative sample of 17,484 noninstitutionalized respondents who were interviewed in 1999, found that 45% of individuals experienced at least one upper GI symptom (e.g., heartburn, nausea/vomiting, bloating, abdominal pain, etc.) each month over the past three months.(15) That study also revealed that 82% of Americans experienced an upper GI symptom at any point during that same time period.(15) Sandler and colleagues also conducted a national survey of 2510 respondents in 1997 which focused on the prevalence of abdominal pain, bloating, and/or diarrhea; 41% reported at least one symptom over the past month.(14) Our results from the National GI Survey continue to demonstrate the persistent high burden of GI symptoms among community-dwelling Americans. As GI symptoms are both common and can cause significant physical, mental, and social distress (34), it becomes vital for healthcare providers to proactively screen for these symptoms. Yet, it is also important to note that many symptomatic individuals do not actively seek care from healthcare providers. In the study by Sandler et al., only 19%, 16%, and 9% of those with abdominal pain, bloating, and diarrhea, respectively, consulted a physician about their symptoms.(14) Developing strategies for reaching out and encouraging these individuals to engage with the healthcare system is paramount, particularly as many will have treatable disorders.
We also found differences in symptom prevalence among the various racial/ethnic groups. Namely, non-Hispanic blacks and Asians are 31% and 35% less likely, respectively, to have experienced GI symptoms within the past week compared to non-Hispanic whites. Non-Hispanic blacks and Asians along with Latinos also have lower odds for reporting concomitant symptoms. Whether this reflects a truly lower symptom burden or cultural factors in reporting symptoms is unclear. In the population-based study by Sandler and colleagues, no differences were seen between whites and non-whites in the prevalence of abdominal pain/discomfort or bloating/distension.(14) However, they did find that a higher proportion of whites reported diarrhea.(14) In a systematic review by Higgins and Johanson focused on constipation, they found that non-whites are 13% to 189% more likely to have constipation vs. whites.(12) As for heartburn/reflux, the most commonly reported symptom in our study, El-Serag and colleagues found no differences in symptom prevalence between whites, blacks, and others.(35) It is worth mentioning that these prior studies along with others had limited number of individuals from other racial/ethnic groups, including Latinos and Asians, and resorted to grouping them as non-whites.(12, 14, 35, 36) This is problematic given the increasing diversity of the U.S. population and marked heterogeneity and cultural differences among the various groups. However, this is where use of Internet-accessible survey platforms can lead to effective and efficient recruitment of a diverse population. Our online platform led to a study cohort that mirrors data from the latest U.S. Census and captures the rich racial/ethnic diversity of America.(37)
We also found that higher educational attainment is associated with increased prevalence of GI symptoms. Namely, more education led to 40% to 77% increased odds for reporting a symptom within the past week. The prior literature, both in the U.S. and worldwide, has shown an inconsistent relationship between GI symptoms and education level. Camilleri et al. showed an inverse relationship between education and GI symptoms; less educated individuals are more likely to be symptomatic.(15) A Korean population-based study by Jeong and colleagues similarly found that individuals with chronic GI symptoms are more likely to have less education.(38) Conversely, among a representative sample of Singaporeans in which Chinese and Indians received more education than Malays, chronic GI symptoms are equally prevalent among the three groups.(39)
In contrast to education, we found that increasing age is associated with decreased reporting of symptoms. Those in the 45 to 64 year old and ≥65 year old groups are 16% and 37% less likely, respectively, to have had GI symptoms in the past week when compared to their younger counterparts. Even in subgroup analysis among those who did not report any medical comorbidities, increasing age was still significantly associated with decreased odds for reporting GI symptoms. This is consistent with findings from Drossman et al. and Chang et al. who also found that reporting of most functional GI syndromes decreases with age, with the main exception being fecal incontinence.(9, 40) Sandler and colleagues similarly found a lower prevalence of abdominal pain, bloating, and diarrhea among those 60 years of age and older.(14) While elderly individuals are more likely to have disorders (e.g., diabetes, Parkinson’s disease, etc.) and take medications (e.g., calcium channel blockers, antidepressants, etc.) that affect the GI tract (41), this does not appear to translate to increased GI symptom burden. However, prior population-based surveys (9, 14), including our own, may have selected for healthier, more functional, and/or independent elderly respondents, thereby underestimating the prevalence of GI symptoms among this subgroup.
We also found that overlapping GI symptoms are common in the general U.S. population. Among symptomatic individuals, nearly 60% experience two or more concomitant symptoms. As expected, predictors of overlapping GI symptoms are similar to predictors for presence of any GI symptoms. Namely, younger age, female gender, non-Hispanic white race/ethnicity, increasing education level, married status, and increasing number of medical comorbidities are significantly associated with having co-occurring GI symptoms. With respect to specific GI symptom combinations, we noted that both heartburn/reflux and abdominal pain frequently co-occur with bloat/gas, constipation, and diarrhea in the general population. This is in line with the US Upper Gastrointestinal study which noted that many of those with heartburn/reflux also report bloating and abdominal pain.(15) As heartburn/reflex and abdominal pain are the two most common symptoms, healthcare providers should proactively screen for other concomitant symptoms, particularly bloating/gas and altered bowel habits. Our findings are also consistent with other studies focused on overlapping functional GI disorders.(9, 42, 43) For example, a study of an urban Australian population by Talley and colleagues demonstrated that 57% and 40% of those with irritable bowel syndrome also had dyspepsia and heartburn, respectively.(43)
Our study has important limitations. First, there is risk of recall bias since the symptom data were self-reported. However, the recall period for GI PROMIS questionnaires is only one week, and PROMIS questionnaire have been widely validated as part of an NIH consortium.(21, 44–46) Second, the National GI Survey was cross-sectional; we did not longitudinally follow respondents to assess for chronicity of their symptoms. A third limitation relates to generalizability, as the survey was administered solely online. While at the time of our survey in 2015, 86% of Americans were using the Internet (32), our results nonetheless may not be generalizable to those who do not possess basic computing skills or lack regular access to the Internet. However, data from the Pew Research Center showed that Internet use was common even among individuals ≥65 years old (63%), those with (78%) and without a high school degree (62%), and those earning less than $30,000/year (76%).(32) Fourth, while the survey research firm employed U.S. census region quotas to facilitate recruitment of a population-based sample, we did not have access to region data for each individual respondent. We were thus unable to assess for geographical variations in GI symptoms. Fifth, the National GI Survey also did not collect information on certain demographic and lifestyle factors that may impact prevalence of GI symptoms, including body mass index and use of tobacco or alcohol. We also did not collect information on current use of prescription and over-the-counter medicines. While the interplay of these medicines on GI symptom prevalence can be difficult to disentangle (e.g., proton pump inhibitors may reduce heartburn/reflux and abdominal pain symptoms but may increase the odds for bloating and diarrhea), it is nonetheless an important factor to consider. In our upcoming National GI Survey 2, we aim to address these issues by systematically collecting information on body mass index, tobacco, alcohol, and medication use, as well as geographic location. Finally, there is a risk of participation bias through describing the study as a “GI Survey” to potential respondents. GI symptom prevalence could have been overestimated if users without GI symptoms chose not to respond. While this is a common limitation for this type of study, we aimed to minimize participation bias through the reward system which incentivizes users, even those without GI symptoms, to complete the survey. In fact, 39% of respondents did not report any symptoms within the past week. Additionally, our results are largely in line with other population-based studies both in the U.S. and internationally, supporting the validity of our findings.(9–15) Moreover, we would also not expect this to have affected our overlapping GI symptom regression analysis, as it is unlikely that there are systematic differences between survey responders and non-responders with GI symptoms.
In conclusion, in a representative sample of over 71,000 Americans, we found that nearly 2 out of 3 individuals are burdened by GI symptoms. There is also an uneven distribution of symptoms, as younger individuals, females, non-Hispanic whites, higher-educated individuals, and those with medical comorbidities are more likely to be symptomatic. Further research is needed to evaluate the role of age, race/ethnicity, culture, and education level on symptom prevalence. Our study also serves as a model for the use of novel digital health technologies for effectively and efficiently collecting population-based data both in gastroenterology/hepatology and other areas of medicine.
Supplementary Material
STUDY HIGHLIGHTS.
What is current knowledge?
Digestive diseases account for over 100 million ambulatory care visits annually in the U.S.
Yet, individuals first experience gastrointestinal (GI) symptoms prior to presenting to healthcare providers for evaluation and management of their symptoms.
Comparatively less work has been done to examine the true burden of GI symptoms in the general U.S. population.
What is new here?
We conducted the National GI Survey using a novel online digital health tool that employs NIH PROMIS questionnaires to systematically collect GI symptom information.
In a population-based sample of over 71,000 Americans, we found that 2 out of 3 individuals experienced a GI symptom(s) within the past week.
Overlapping GI symptoms were common, as nearly 60% of symptomatic respondents had ≥2 concurrent symptoms.
Acknowledgments
Financial Support:
This study was supported by a career development award from the American College of Gastroenterology (Dr. Almario). The National GI Survey was funded by Ironwood Pharmaceuticals. The Cedars-Sinai Center for Outcomes Research and Education (CS-CORE) is supported by The Marc and Sheri Rapaport Fund for Digital Health Sciences & Precision Health. Drs. Almario and Spiegel are supported by a CTSI grant from the NIH/NCATS UL1TR001881–01.
Footnotes
Guarantor of the Article: Brennan M.R. Spiegel, MD, MSHS
Potential Competing Interests:
Drs. Spiegel and Chey are consultants for Ironwood Pharmaceuticals. Drs. Spiegel and Chey are also patent holders and principals at My Total Health. Dr. Almario has a stock option grant in My Total Health. Drs. Ballal, Nordstrom, and Khanna do not have any relevant disclosures.
REFERENCES
- 1.Everhart JE, Ruhl CE. Burden of digestive diseases in the United States part I: overall and upper gastrointestinal diseases. Gastroenterology 2009;136:376–86. [DOI] [PubMed] [Google Scholar]
- 2.Peery AF, Crockett SD, Barritt AS, et al. Burden of gastrointestinal, liver, and pancreatic diseases in the United States. Gastroenterology 2015;149:1731–1741.e3. [DOI] [PMC free article] [PubMed] [Google Scholar]
- 3.Everhart JE, Ruhl CE. Burden of digestive diseases in the United States part II: lower gastrointestinal diseases. Gastroenterology 2009;136:741–54. [DOI] [PubMed] [Google Scholar]
- 4.Everhart JE, Ruhl CE. Burden of digestive diseases in the United States Part III: liver, biliary tract, and pancreas. Gastroenterology 2009;136:1134–44. [DOI] [PubMed] [Google Scholar]
- 5.Peery AF, Dellon ES, Lund J, et al. Burden of gastrointestinal disease in the United States: 2012 update. Gastroenterology 2012;143:1179–87.e1–3. [DOI] [PMC free article] [PubMed] [Google Scholar]
- 6.Russo MW, Wei JT, Thiny MT, et al. Digestive and liver diseases statistics, 2004. Gastroenterology 2004;126:1448–53. [DOI] [PubMed] [Google Scholar]
- 7.Sandler RS, Everhart JE, Donowitz M, et al. The burden of selected digestive diseases in the United States. Gastroenterology 2002;122:1500–11. [DOI] [PubMed] [Google Scholar]
- 8.Shaheen NJ, Hansen RA, Morgan DR, et al. The burden of gastrointestinal and liver diseases, 2006. Am J Gastroenterol 2006;101:2128–38. [DOI] [PubMed] [Google Scholar]
- 9.Drossman DA, Li Z, Andruzzi E, et al. U.S. householder survey of functional gastrointestinal disorders. Prevalence, sociodemography, and health impact. Dig Dis Sci 1993;38:1569–80. [DOI] [PubMed] [Google Scholar]
- 10.El-Serag HB, Sweet S, Winchester CC, et al. Update on the epidemiology of gastro-oesophageal reflux disease: a systematic review. Gut 2014;63:871–80. [DOI] [PMC free article] [PubMed] [Google Scholar]
- 11.Frank L, Kleinman L, Ganoczy D, et al. Upper gastrointestinal symptoms in North America: prevalence and relationship to healthcare utilization and quality of life. Dig Dis Sci 2000;45:809–18. [DOI] [PubMed] [Google Scholar]
- 12.Higgins PD, Johanson JF. Epidemiology of constipation in North America: a systematic review. Am J Gastroenterol 2004;99:750–9. [DOI] [PubMed] [Google Scholar]
- 13.Locke GR 3rd, Talley NJ, Fett SL, et al. Prevalence and clinical spectrum of gastroesophageal reflux: a population-based study in Olmsted County, Minnesota. Gastroenterology 1997;112:1448–56. [DOI] [PubMed] [Google Scholar]
- 14.Sandler RS, Stewart WF, Liberman JN, et al. Abdominal pain, bloating, and diarrhea in the United States: prevalence and impact. Dig Dis Sci 2000;45:1166–71. [DOI] [PubMed] [Google Scholar]
- 15.Camilleri M, Dubois D, Coulie B, et al. Prevalence and socioeconomic impact of upper gastrointestinal disorders in the United States: results of the US Upper Gastrointestinal Study. Clin Gastroenterol Hepatol 2005;3:543–52. [DOI] [PubMed] [Google Scholar]
- 16.Shah ED, Almario CV, Spiegel BMR, et al. Lower and upper gastrointestinal symptoms differ between individuals with irritable bowel syndrome with constipation or chronic idiopathic constipation. J Neurogastroenterol Motil 2018;24:299–306. [DOI] [PMC free article] [PubMed] [Google Scholar]
- 17.Menees SB, Almario CV, Spiegel BMR, et al. Prevalence of and factors associated with fecal incontinence: results from a population-based survey. Gastroenterology 2018;154:1672–1681.e3. [DOI] [PMC free article] [PubMed] [Google Scholar]
- 18.Almario CV, Almario AA, Cunningham ME, et al. Old farts - fact or fiction? Results from a population-based survey of 16,000 Americans examining the association between age and flatus. Clin Gastroenterol Hepatol 2017;15:1308–1310. [DOI] [PubMed] [Google Scholar]
- 19.Nagaraja V, Hays RD, Khanna PP, et al. Construct validity of the Patient-Reported Outcomes Measurement Information System gastrointestinal symptom scales in systemic sclerosis. Arthritis Care Res (Hoboken) 2014;66:1725–30. [DOI] [PMC free article] [PubMed] [Google Scholar]
- 20.Spiegel BM. Patient-reported outcomes in gastroenterology: clinical and research applications. J Neurogastroenterol Motil 2013;19:137–48. [DOI] [PMC free article] [PubMed] [Google Scholar]
- 21.Spiegel BM, Hays RD, Bolus R, et al. Development of the NIH Patient-Reported Outcomes Measurement Information System (PROMIS) gastrointestinal symptom scales. Am J Gastroenterol 2014;109:1804–14. [DOI] [PMC free article] [PubMed] [Google Scholar]
- 22.HealthMeasures. Obtain & administer measures. 2018. [cited 2018 July 17]; Available from: http://www.healthmeasures.net/explore-measurement-systems/promis/obtain-administer-measures
- 23.Levy PS, Lemeshow S. Sampling of populations: methods and applications: John Wiley & Sons; 2013. [Google Scholar]
- 24.Stata.com. Poststratification — poststratification for survey data. 2018. [cited 2018 June 15]; Available from: https://www.stata.com/manuals13/svypoststratification.pdf
- 25.Howden LM, Meyer JA. Age and sex composition: 2010. 2011. [cited 2016 September 13]; Available from: http://www.census.gov/prod/cen2010/briefs/c2010br-03.pdf
- 26.The Henry J Kaiser Family Foundation. Population distribution by race/ethnicity. 2016. [cited 2016 September 13]; Available from: http://kff.org/other/state-indicator/distribution-by-raceethnicity/?currentTimeframe=0&sortModel=%7B%22colId%22:%22Location%22,%22sort%22:%22asc%22%7D
- 27.Almario CV, Chey W, Kaung A, et al. Computer-generated vs. physician-documented history of present illness (HPI): results of a blinded comparison. Am J Gastroenterol 2015;110:170–9. [DOI] [PMC free article] [PubMed] [Google Scholar]
- 28.Almario CV, Chey WD, Iriana S, et al. Computer versus physician identification of gastrointestinal alarm features. Int J Med Inform 2015;84:1111–7. [DOI] [PMC free article] [PubMed] [Google Scholar]
- 29.UCLA Center for Health Policy Research. California Health Interview Survey. 2017. [cited 2017 December 1]; Available from: http://healthpolicy.ucla.edu/chis/
- 30.Centers for Disease Control and Prevention. National Health Interview Survey. 2017. [cited 2017 December 1]; Available from: https://www.cdc.gov/nchs/nhis/index.htm
- 31.Corrigan JM, Greiner AC, Adams K. 1st Annual Crossing the Quality Chasm Summit: a focus on communities: National Academies Press; 2004. [PubMed] [Google Scholar]
- 32.Pew Research Center. Internet/broadband fact sheet. 2017. [cited 2017 December 7]; Available from: http://www.pewinternet.org/fact-sheet/internet-broadband/
- 33.Nguyen A, Mosadeghi S, Almario CV. Persistent digital divide in access to and use of the Internet as a resource for health information: results from a California population-based study. Int J Med Inform 2017;103:49–54. [DOI] [PubMed] [Google Scholar]
- 34.Spiegel BM, Khanna D, Bolus R, et al. Understanding gastrointestinal distress: a framework for clinical practice. Am J Gastroenterol 2011;106:380–5. [DOI] [PMC free article] [PubMed] [Google Scholar]
- 35.El-Serag HB, Petersen NJ, Carter J, et al. Gastroesophageal reflux among different racial groups in the United States. Gastroenterology 2004;126:1692–1699. [DOI] [PubMed] [Google Scholar]
- 36.Sharma P, Wani S, Romero Y, et al. Racial and geographic issues in gastroesophageal reflux disease. Am J Gastroenterol 2008;103:2669–80. [DOI] [PubMed] [Google Scholar]
- 37.U.S. Census Bureau. American Community Survey 1-year estimates. 2016. [cited 2017 December 1]; Available from: https://censusreporter.org/profiles/01000US-united-states
- 38.Jeong JJ, Choi MG, Cho YS, et al. Chronic gastrointestinal symptoms and quality of life in the Korean population. World J Gastroenterol 2008;14:6388–94. [DOI] [PMC free article] [PubMed] [Google Scholar]
- 39.Ho KY, Kang JY, Seow A. Prevalence of gastrointestinal symptoms in a multiracial Asian population, with particular reference to reflux-type symptoms. Am J Gastroneterol 1998;93:1816–1822. [DOI] [PubMed] [Google Scholar]
- 40.Chang L, Toner BB, Fukudo S, et al. Gender, age, society, culture, and the patient’s perspective in the functional gastrointestinal disorders. Gastroenterology 2006;130:1435–46. [DOI] [PubMed] [Google Scholar]
- 41.O’Mahony D, O’Leary P, Quigley EM. Aging and intestinal motility: a review of factors that affect intestinal motility in the aged. Drugs Aging 2002;19:515–27. [DOI] [PubMed] [Google Scholar]
- 42.Agreus L, Svardsudd K, Nyren O, et al. Irritable bowel syndrome and dyspepsia in the general population: overlap and lack of stability over time. Gastroenterology 1995;109:671–80. [DOI] [PubMed] [Google Scholar]
- 43.Talley NJ, Boyce P, Jones M. Identification of distinct upper and lower gastrointestinal symptom groupings in an urban population. Gut 1998;42:690–5. [DOI] [PMC free article] [PubMed] [Google Scholar]
- 44.Cella D, Riley W, Stone A, et al. The Patient-Reported Outcomes Measurement Information System (PROMIS) developed and tested its first wave of adult self-reported health outcome item banks: 2005–2008. J Clin Epidemiol 2010;63:1179–1194. [DOI] [PMC free article] [PubMed] [Google Scholar]
- 45.Cella D, Yount S, Rothrock N, et al. The Patient-Reported Outcomes Measurement Information System (PROMIS): progress of an NIH Roadmap cooperative group during its first two years. Med Care 2007;45:S3. [DOI] [PMC free article] [PubMed] [Google Scholar]
- 46.Kochar B, Martin CF, Kappelman MD, et al. Evaluation of Gastrointestinal Patient Reported Outcomes Measurement Information System (GI-PROMIS) symptom scales in subjects with inflammatory bowel diseases. Am J Gastroenterol 2018;113:72–79. [DOI] [PubMed] [Google Scholar]
Associated Data
This section collects any data citations, data availability statements, or supplementary materials included in this article.