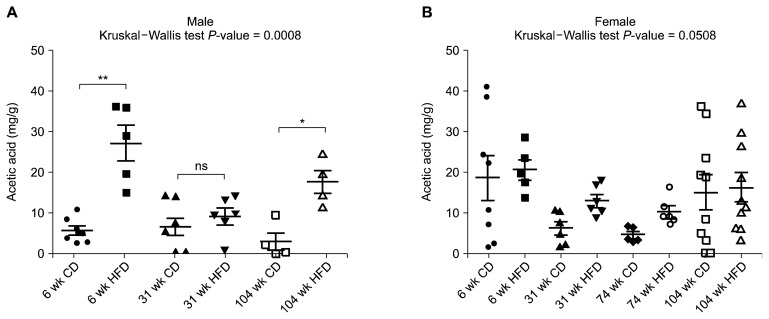
Figure 2.
Ileal acetic acid concentration (mg/g) of male (A) and female (B) rats. Data are expressed as mean ± SEM; P-values to Kruskal–Wallis test are designated on the figure; *P < 0.05; **P < 0.01; ns: not significant; representing statistical significance according to Mann–Whitney U-test with Bonferroni correction. CD, chow diet; HFD, high-fat diet.

