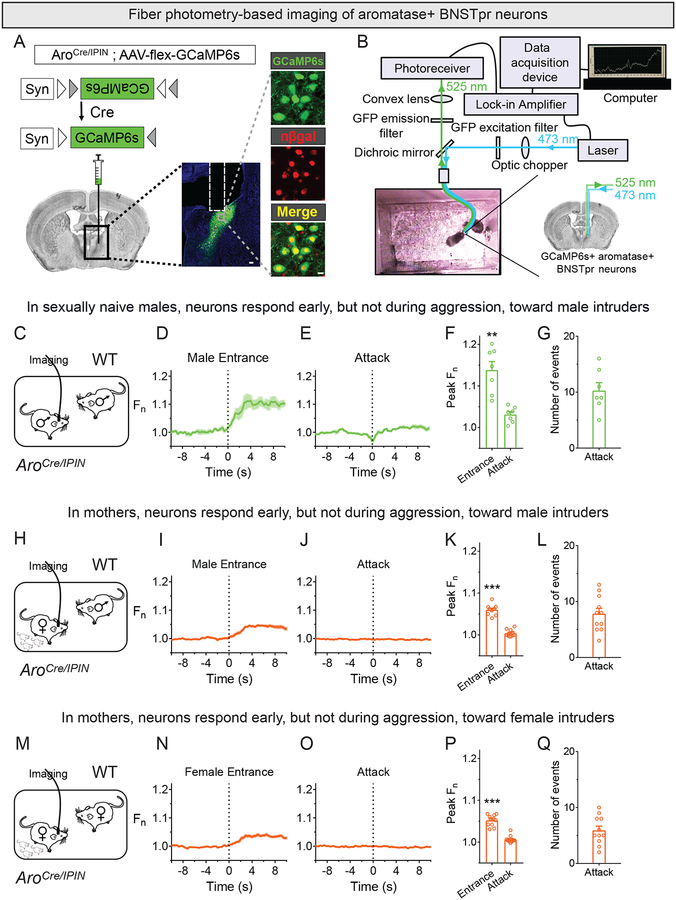
Figure 1: AB neurons are transiently activated in aggressive encounters.
(A) Strategy to express GCaMP6s in AB neurons. Coronal section through adult male BNST (middle panel) expressing GCaMP6s and nuclear β-galactosidase (scale bar = 100 μm). Midline is on right, and tract of optic fiber implant is outlined dorsal to BNST. Insets show higher magnification of gray box in the middle panel (scale bar = 10 μm).
(B) Fiber photometry setup to image GCaMP6s in a freely behaving mouse.
(C-Q) Fiber photometry imaging of AB neurons in singly housed AroCre/IPIN male (C-G) or mother (H-Q) interacting with WT intruder for 15 min.
(C) A WT male is inserted into the cage of a sexually naïve male.
(D,E) Peri-event time plot (PETP) of GCaMP6s signal around entry of male and onset of attack episodes. For PETPs shown in this and other Figures, dark colored line and paler shaded region represent mean fluorescence and SEM, respectively. Vertical dashed black line indicates beginning of event or behavior; Fn on y-axis of PETP represents fold change from baseline preceding the event.
(F) GCaMP6s signal increases upon entry of male. Peak Fn represents maximal fold change from baseline preceding the event. Tests of significance were performed, unless otherwise mentioned, by comparing peak Fn of various events to baseline GCaMP6s fluorescence preceding the event and correcting for multiple comparisons.
(G) Number of attacks by resident male.
(H) Male is inserted into the cage of a mother.
(I-K) GCaMP6s signal increases in mothers upon entry of male but not when she attacks him.
(L) Number of attacks by mothers.
(M) Female is inserted into the cage of a mother.
(N-P) GCaMP6s signal increases in mothers upon entry of female but not when she attacks her.
(Q) Number of attacks by mothers.
Mean ± SEM; hollow circles represent individual mice in these and subsequent figures. n = 7 (C-G), 11 (H-Q). **p<0.01, ***p<0.001. See also Figure S1, Table S1, and Movie S1.

