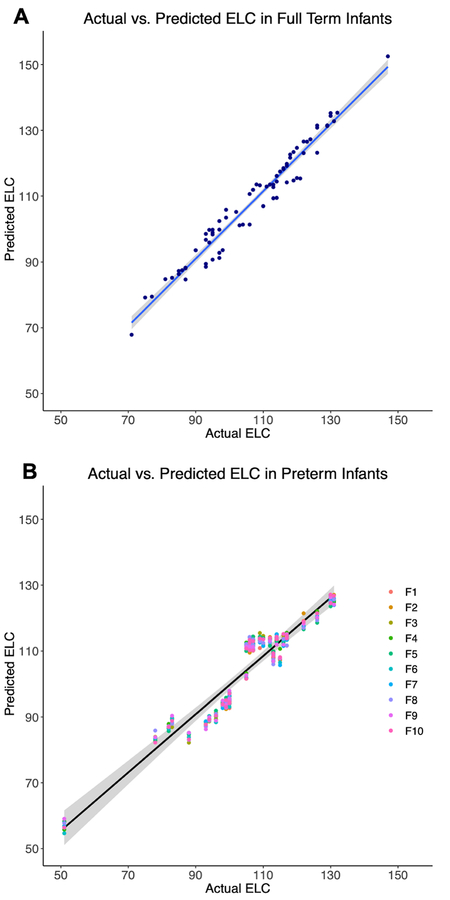
Figure 4: Correlations between actual and predicted 2-year cognitive scores.
Estimated ELC scores generated through regression prediction models are plotted against each FT infant’s actual ELC score, along with linear regression lines (blue line) and shaded 95% confidence intervals (A). PT infants were classified using each of the 10 models generated through cross-validation. Estimated ELC scores are presented for each of the 10 folds (B), where the first fold is represented by F1, along with the linear regression line (black line) for the mean predicted score across folds and a 95% confidence interval for the regression fit.

