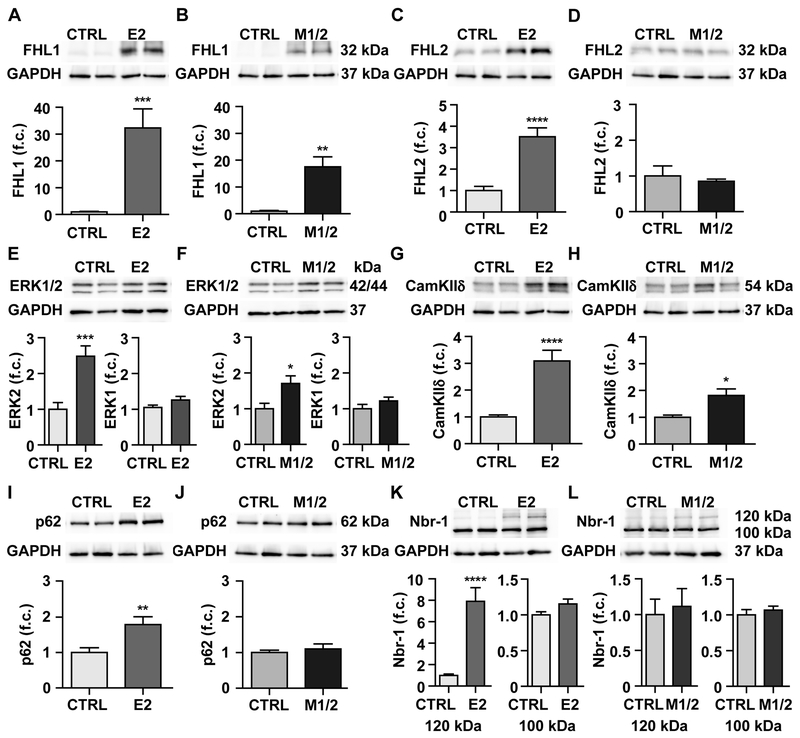
Figure 6. Expression of titin binding and stretch signaling proteins.
Western blot analysis of heart lysate from control (CTRL) and E2-KO (left) and control and M1/2-KO (right) at 4 weeks of age. A-D) FHL1 is upregulated in both strains, while FHL2 is only upregulated in the E2-KO. E, F) ERK2 is upregulated in the E2 and to a lesser degree in the M1/2-KO, while ERK1 is not changed. G, H) CamKIIδ is significant upregulated in the E2 and to a lesser degree in the M1/2-KO. I, J) The titin binding protein p62 is upregulated in the E2-, but unchanged in the M1/2-KO. K, L) Nbr1 is unchanged between genotypes, except for the 120 kDa isoform, which is induced almost 8-fold in the E2-KO only. Student’s T-test, * p < 0.05; ** p < 0.01; *** p < 0.001; **** p < 0.0001; n = 8-11 animals per group. f.c. fold change

