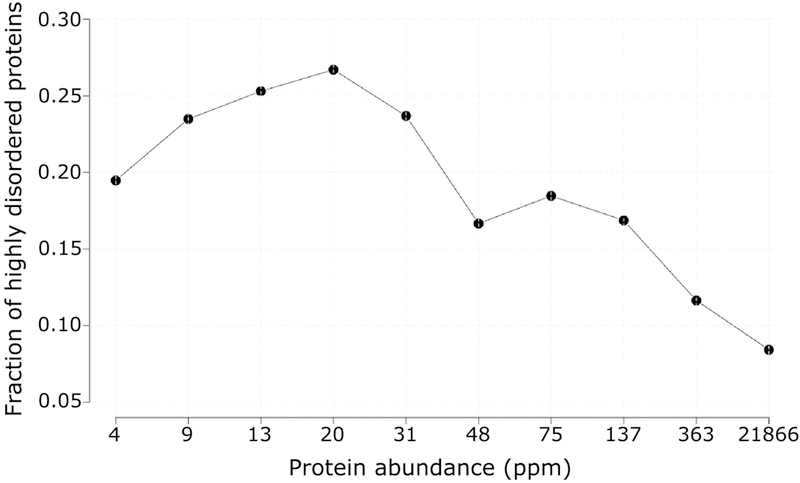
Figure 1.
Fraction of S. cerevisiae proteins with a high degree of putative intrinsic disorder, as a function of their cellular abundance.
The graph reveals a strong negative correlation between the fraction of highly disordered proteins and the corresponding protein abundance level (Spearman correlation rS = −0.76, pvalue = 0.02). A stronger and highly significant correlation is obtained when applying a somewhat higher abundance threshold and a lower but significant correlation when taking into account the fraction of all the disordered residues in a protein (see text). Proteins featuring a high degree of intrinsic disorder are defined as those containing ≥30% of their residues in IDRs of at least 20 consecutive residues. Proteins in the yeast proteome were divided according to their abundance into ten equally populated bins (498 proteins each). Numbers along the horizontal axis represent the rounded upper limit in the protein abundance range of each bin.

