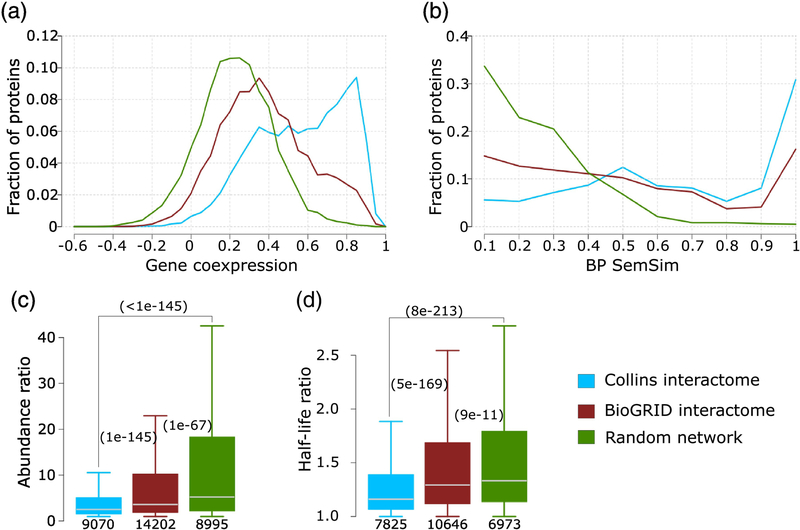
Figure 10.
Comparing the Collins and BioGRID interactomes of S. cerevisiae.
The HC interactome of Collins [40] and the multi-validated BioGRID interactome [65] (March 2018) are compared against each other and to a random PPI network (see Material and Methods for detail). Four properties of interacting proteins pairs in the network are compared: a) Pearson correlation coefficient of mRNA expression profiles (gene co-expression), b) the semantic similarity of the biological process GO annotation (BP SemSim), c) the ratio of protein abundance levels and d) the ratio of protein half-life. Panels c, d) p-values (computed using the Wilcoxon rank-sum test) between pairs of distributions in the three networks are given in parentheses. The number of data points in each distribution is shown below each boxplot. Data on protein abundance are from PaxDb [39], and those on half-life are from reference [78].

