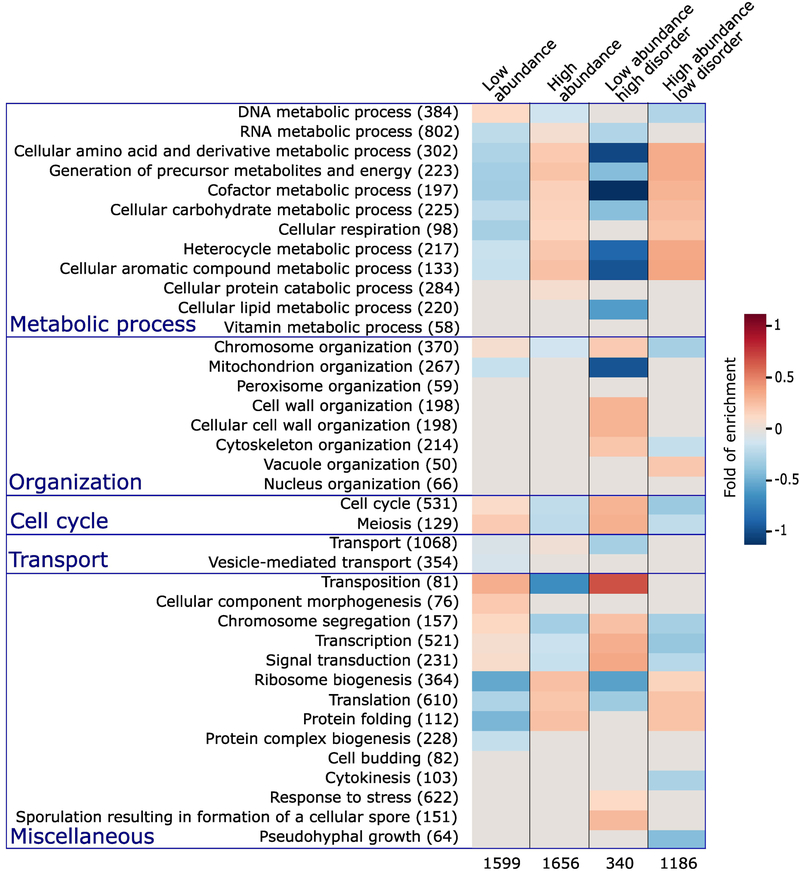
Figure 2.
Enrichment in Gene Ontology terms for proteins with different abundance levels and intrinsic disorder contents.
The first column lists the biological process (BP) terms of the Gene Ontology [56,57] for which statistically significant enrichments were obtained. The number of S. cerevisiae proteins with the corresponding BP term in the reference dataset is indicated in parentheses. The last 4 columns represent the heat maps of the computed statistically significant enrichment levels for each of the listed BP terms among proteins in the following 4 categories respectively. Proteins among the 33.3 percentile most abundant and least abundant proteins, respectively (columns 2 and 3); the subset of proteins from each of the previous categories with high ( ≥ 30%) and low (<10%) IDR content, respectively (columns 4 and 5). The number of proteins in each of the 4 categories is listed at the bottom. The Biological Process (BP) Gene ontology (GO) terms are those from the GO slim yeast ontology in the BiNGO [84] application for Cytoscape [85] with all possible evidence codes. Enrichments were computed using as reference, all S. cerevisiae proteins with available GO annotation and abundance levels of at least 2 ppm (4900 proteins in total). The statistical significance of the computed enrichment was evaluated using the hypergeometric test with Benjamin and Hochberg false discovery rate (FDR) multiple testing correction [93].

