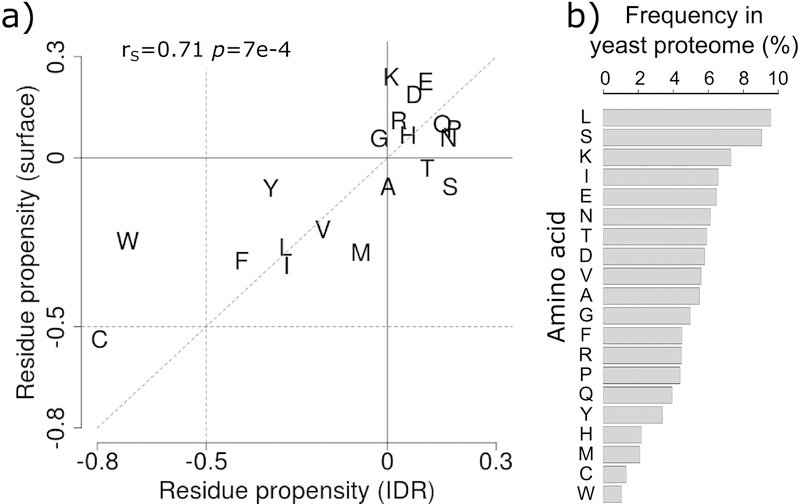
Figure 4.
Comparing amino acid propensities of IDRs to those on surfaces of globular proteins.
a) Amino acid propensities in IDRs ≥20 residues (horizontal axis) versus those on the surfaces of globular proteins/domains (vertical axis) using the yeast proteome as reference (see Materials and Methods). Amino acids are represented by the one-letter code. The Spearman’s correlation coefficient between the two sets of propensities and the corresponding p-value are given at the top of the graph. b) Frequencies of amino acids (%) in the yeast proteome.

