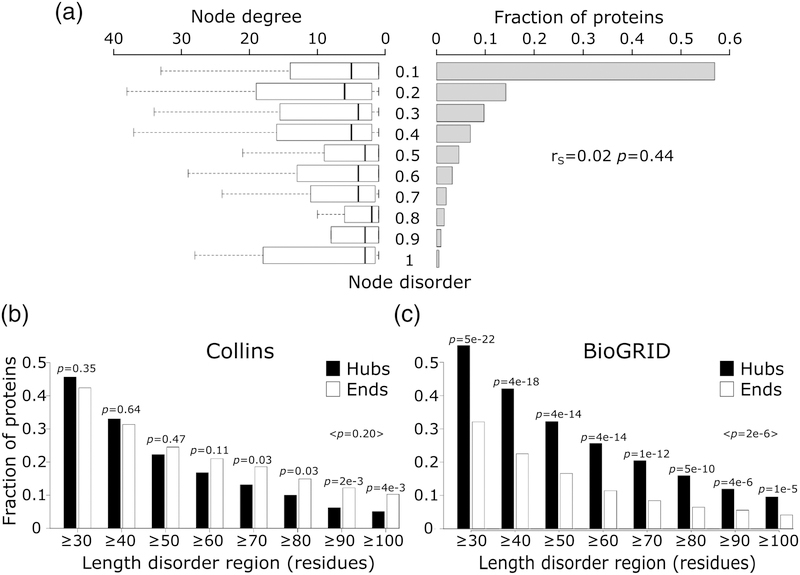
Figure 6.
Node degree of proteins with different levels of intrinsic disorder.
a) Depicted on the right hand side is the histogram of the intrinsic disorder ranges (fraction of disordered residues in IDRs ≥20 residues long) of protein nodes in the Collins yeast PPI network [40]. Shown on the left are boxplots representing the distributions of the number of interaction partners (node degree) for individual disorder ranges of disorder. The Spearman’s correlation coefficient (rS), and its corresponding p-value are given at the right hand side of the panel. b) The fraction of hub (≥10 partners) and ‘end’ (1 partner) proteins at different IDR length cutoffs in the HC yeast PPI network of Collins. c) The same as (b) but for proteins in a recent version of the BioGRID [65] interactome. In both panels, the p-value between the fraction of hub and end proteins was calculated using the two-sample test for equality of proportions with continuity correction (Pearson’s chi-squared statistic).

