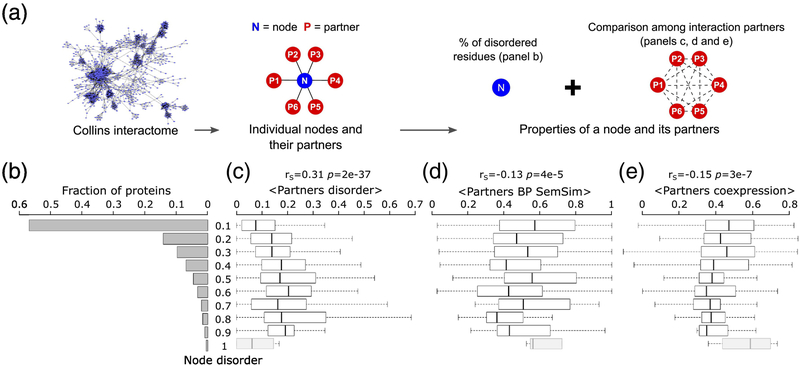
Figure 7.
Relating intrinsic disorder of protein nodes to the properties of their interaction partners.
a) Schematic representation of the source of the values depicted in the following panels. b) histogram of the intrinsic disorder levels of protein nodes of the HC Collins yeast PPI network [40], depicted in Fig. 6a. Shown to the right are box plots representing the distributions of various properties of the interaction partners of protein nodes in the disorder ranges depicted on the far-left histogram: c) Average disorder (fraction of disordered residues in IDRs≥ 20 residues long) of interaction partners, d) average functional similarity (semantic similarity of their biological process gene ontology annotation, BP SemSim) of interactions partners and e) average co-expression (Pearson correlation coefficient of the mRNA expression profiles [38]) of interaction partners. The Spearman’s correlation coefficient (rS), and its corresponding p-value are given at the top of each panel. Nodes with the highest disorder level comprising <10 proteins (greyed box plots), were not considered in the analysis.

