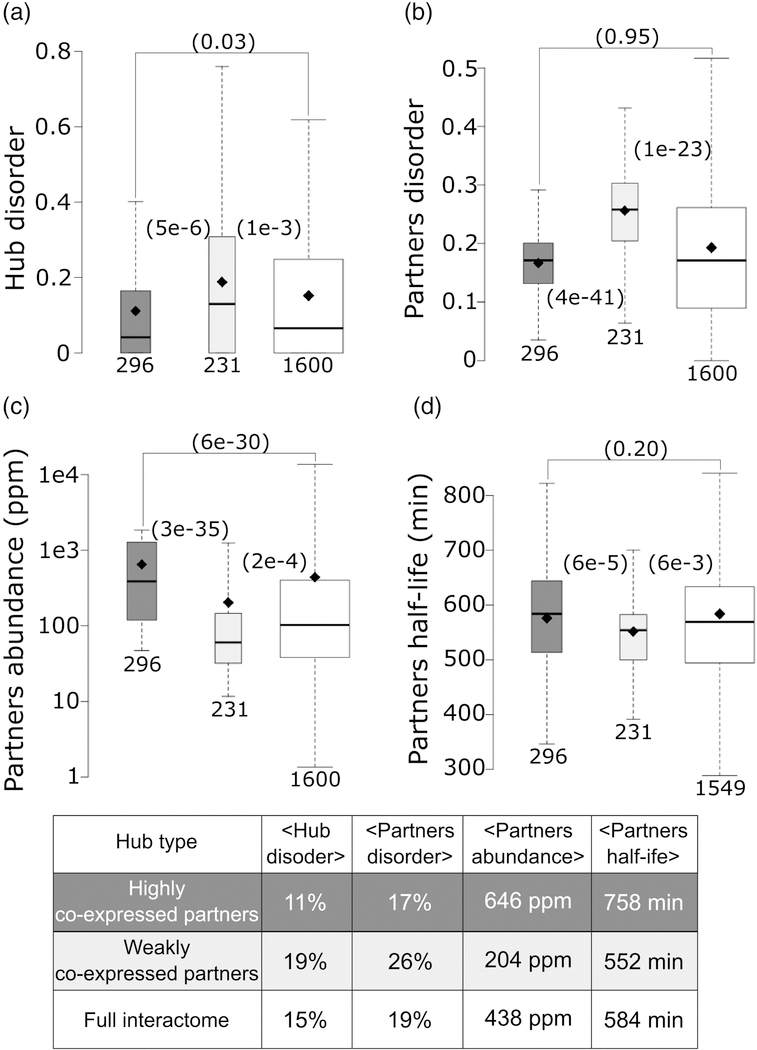
Figure 8.
Contrasting the properties of protein nodes and their interaction partners in hubs with highly and weakly co-expressed interaction partners.
a) Box plots depicting the average disorder level of: hubs with highly co-expressed partners (average partners’ mRNA expression profiles Pearson correlation coefficient ≥0.5; dark gray), hubs with weakly co-expressed partners (average partners’ mRNA expression profiles Pearson correlation coefficient <|0.5|; light gray), all protein nodes in the HC Collins interactome (white), b-d) Boxplots depicting respectively the distributions of: disorder content, abundance levels (ppm) and half-life (min) of the interaction partners for the same 3 categories of protein nodes as in (a). Abundance values are from PaxDb [39] and yeast protein half-lives are taken from reference [78]. p-values (computed using the Wilcoxon rank-sum test) between pairs of distributions in the three groups are given in parentheses. The number of data points in each distribution (n) is shown below each boxplot. The horizontal line in each boxplot indicates the median value and the diamond indicates the mean value. Outliers are not depicted. The Table at the bottom lists the average values of the corresponding displayed distributions.

