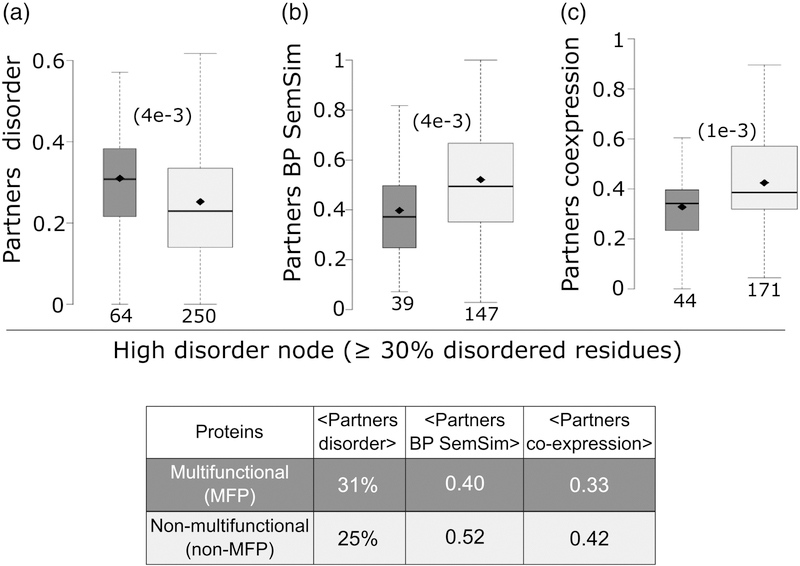
Figure 9.
Relations of high intrinsic disorder content and the multifunctional nature of protein nodes to the properties of their interaction partners.
Panels a-c) compare the distributions of the disorder levels, functional similarity (BP SemSim), and the mRNA co-expression levels, respectively, of interaction partners in the two groups of proteins with a high disorder content (≥30% residues in IDRs ≥20 residues): putative multi-functional protein nodes of the Collins PPI network [40] (dark grey) and nonmulti-functional proteins nodes (light grey). p-values (computed using the Wilcoxon ranksum test) between the pair of distributions are given in parentheses. The number of data points in each distribution is shown below each boxplot. The horizontal line in each boxplot indicates the median value and the diamond indicates the mean value. Outliers are not depicted. The Table at the bottom lists the average values of the corresponding displayed distributions.

