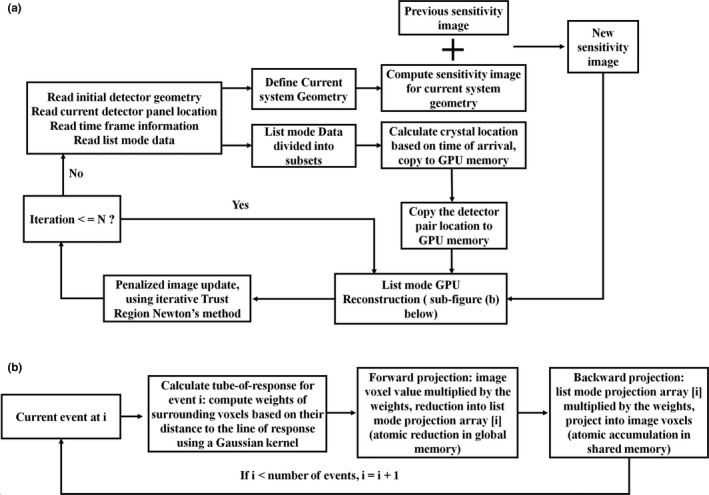
Figure 1.

(a) Structure of the fully 3‐D GPU‐based list‐mode image reconstruction workflow. The PET detector trajectories are modeled as a series of static positions during the scan. Current system geometry is computed from the initial detector geometry and the current locations of detector panels. Sensitivity image of current system geometry is computed and added to the previous sensitivity image for image reconstruction using all list‐mode events acquired so far. Using the arrival time of each event and the time frame information of each panel location, the crystal positions of each coincidence event are calculated and sent to GPU memory for list‐mode image reconstruction. The image reconstruction will stop after a pre‐defined number of iterations (N = 10 in this work). (b) Flowchart showing list‐mode GPU reconstruction kernel.
