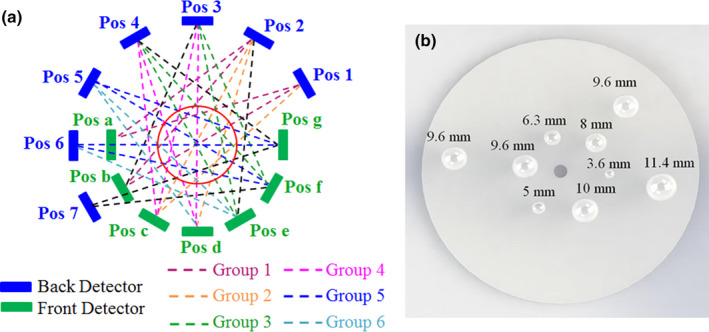
Figure 4.

(a) An illustration showing the locations of the two PET detectors and the sampling pattern used to image the cylindrical phantom. The blue block denotes the back detector while the green block denotes the front detector. The red circle represents the cylindrical phantom. The coincidence events were acquired at 27 angles by placing both the front and back detectors at seven different positions, as illustrated in dashed line (of all colors); (b) The distribution of nine spherical tumors simulated in the Monte Carlo study. The tumors were each placed at the center slice of the cylindrical phantom. [Color figure can be viewed at wileyonlinelibrary.com]
