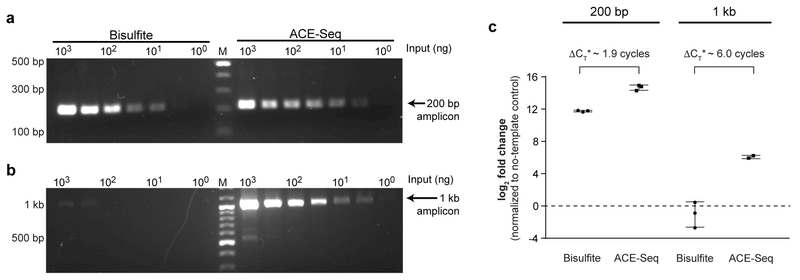
Figure 3. ACE-Seq is nondestructive.
Initial input levels of gDNA from mESCs were titrated from 1 µg to 1 ng, and the samples were treated with either BS-Seq or ACE-Seq protocols. Primers were designed to amplify either (a) a 200-bp amplicon or (b) a 1-kb amplicon from the Tbx5 genomic locus, using 35 cycles of PCR. Resulting amplicons were run on 1.5% agarose gels and stained with SybrSafe. Marker (M) is in the middle lane with bold bands at 1 kb and 500 bp. Bisulfite experiment was performed twice with similar results, and used to inform conditions for the ACE-Seq experiment. (c) The samples were additionally analyzed by qPCR. Plotted is the difference between threshold cycle (CT) in the absence of template (water-only control) versus reactions containing 1 µg of template. Unlike in (a,b) where input amount was normalized, the volume input was normalized with qPCR, resulting in 2-fold less BS-Seq input relative to ACE-Seq. Data are reported as collected, but ΔCT* denotes subtraction of 1 cycle from ACE-Seq measurements to account for a 2-fold difference in initial input due to dilution. qPCR data for other input concentrations of gDNA are reported in Supplementary Fig. 5. Individual triplicate data points are plotted, and error bars represent the standard deviation.

