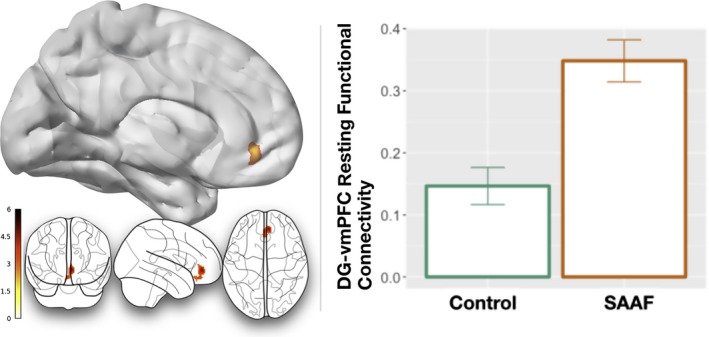
Figure 1.

The left‐hand side of this graphic shows the spatial location of the cluster of interest that emerged. Connectivity between this portion of the ventromedial portions of the prefrontal cortex (vmPFC) and the DG emerged using a restricted (a priori) mask. Similar results were found if a larger, whole‐prefrontal cortex mask was also used. The right‐hand side of this graphic shows the functional connectivity differences between groups. Strong African American Families (SAAF) participants are shown with an orange outlined bar, and control participants are shown with a green outlined bar. The units for this graph are Fisher's Z‐transformed correlation coefficients, with higher values indicating greater coupling between brain regions.
