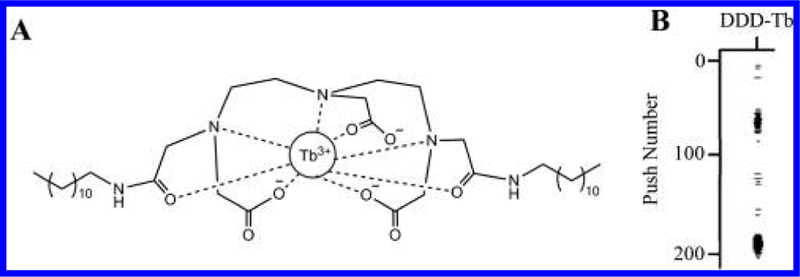
Figure 1.

Structure and function of DDD-Tb ligand. (A) Structure of DDD-Tb, a general membrane stain used in this study to identify organelles. (B) Rain plot showing low background between two detected organelle events, n = 29 858 organelle events. The y-axis identifies the spectra (in sequence) over which detected organelle event signals are integrated. The x-axis shows the relevant m/z channel, 159Tb. Dark lines in the plot area indicate detected 159Tb3+ ions.
