
Figure 2.
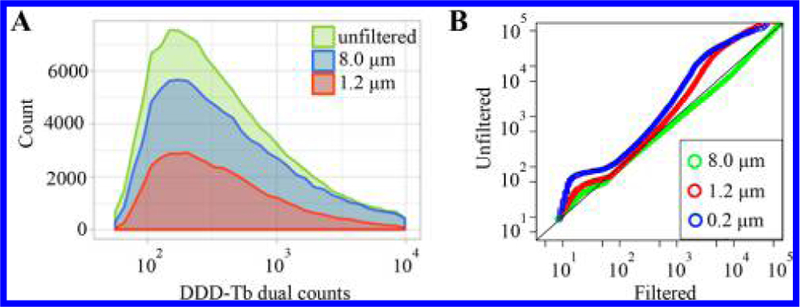
Individual organelle detection via mass cytometry. (A) Distributions of organelle frequency vs DDD-Tb dual count (DC) signal obtained after filtration. The similarity in the mode of DC signal (unfiltered: 294 ± 2.5 dual counts, 8.0 μm: 323 ± 4 dual counts, 1.2 μm: 287 ± 4 dual counts), indicates that detected events represent are likely individual organelles rather than aggregates. (B) QQ-plot comparing the DDD-Tb distributions of filtered or unfiltered samples. The adherence of the 8.0-μm trace to a y = x line suggests the majority of detected events are individual organelles.