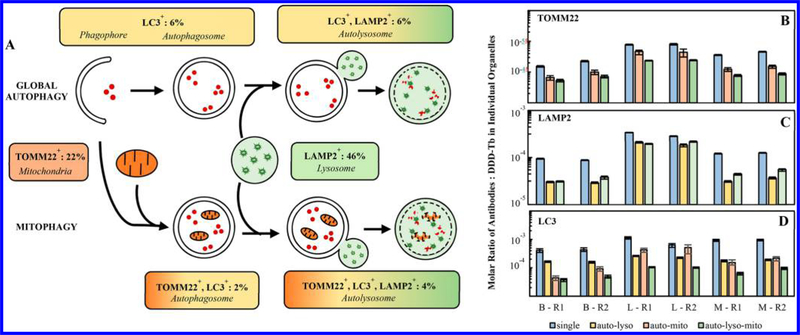
Figure 3.
Characterization of phenotypically unique organelle populations. (A) Phenotypically identified organelles are assigned to the unique organelles which make up the autophagy process. This identification suggests the percentage of each organelle type participating in either macroautophagy or mitophagy in brain tissue. See Figure S-4 for corresponding analysis of liver and skeletal muscle tissue. (B–D) Comparison of each organelle marker across phenotypically unique organelle populations from the same sample and across biological replicates. The number of specific antibodies varies across tissue but is consistent across replicates. Error represented as 95% confidence intervals of the median. B = brain, L = liver, M = skeletal muscle, R1 = biological replicate 1, and R2 = biological replicate 2.

