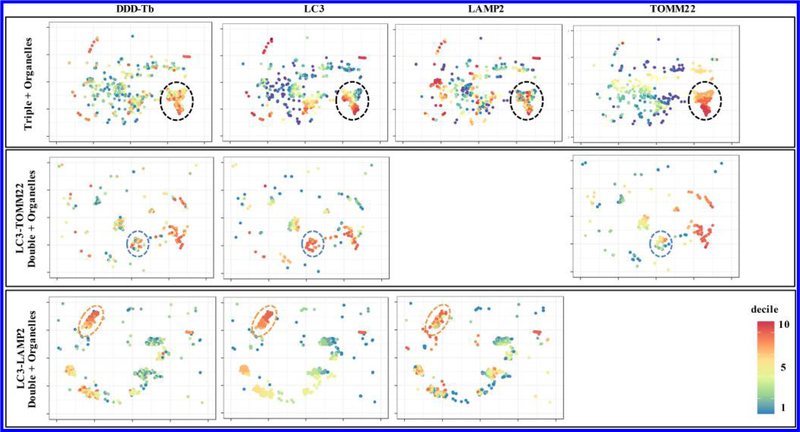
Figure 4.
Two-dimensional cluster analysis of heterogenous autophagy organelle subpopulations. t-SNE plots from brain tissue show phenotypically identified populations of organelles. Distributions of specific markers on individual organelles were binned into deciles and color-coded according to their assigned decile. Wide variation in color across specific markers in t-SNE plots indicate heterogeneous subpopulations which may have significantly different functions. See Figures S-6 and S-7 for corresponding analysis of liver and skeletal muscle tissue, respectively.

