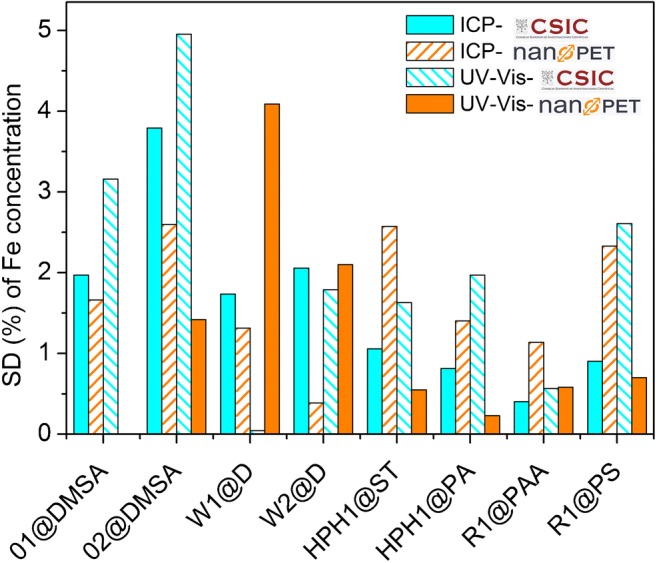
Fig. 3.

Comparison of the standard deviations (%) of the iron concentrations values of all the samples prepared and measured by ICP at CSIC (blue), prepared and measured by spectrophotometry at nanoPET (orange), prepared at CSIC and measured by spectrophotometry at nanoPET (blue stripes), and prepared at nanoPET and measured by ICP at CSIC (orange stripes)
