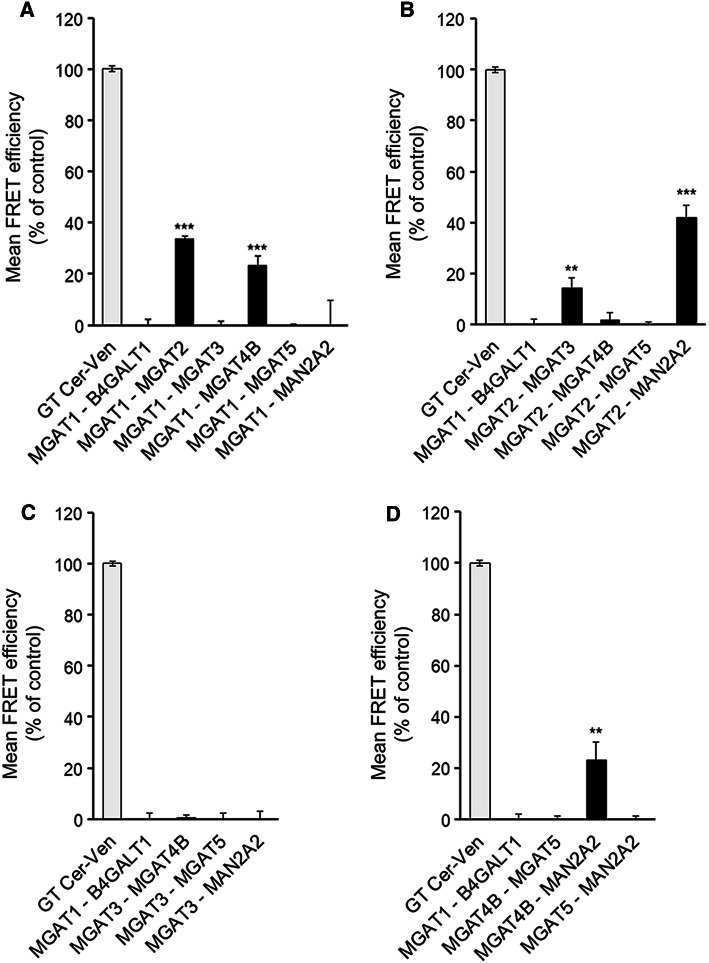
Fig. 1.
Mutual interactions between the medial-Golgi MGATs. A. MGAT1. B. MGAT2. C. MGAT3. D. MGAT4B (as well as MAN2A2 and MGAT5). COS7 cells were transfected with the depicted m-Cerulean- and mVenus-tagged FRET enzyme constructs, fixed 24 h later and quantified with the Operetta High Content Imaging system. FRET efficiencies were calculated and expressed as percentages of control values (mean ± SD, n = 3) after subtracting the FRET efficiencies of negative control (MGAT1-B4GALT1) values

