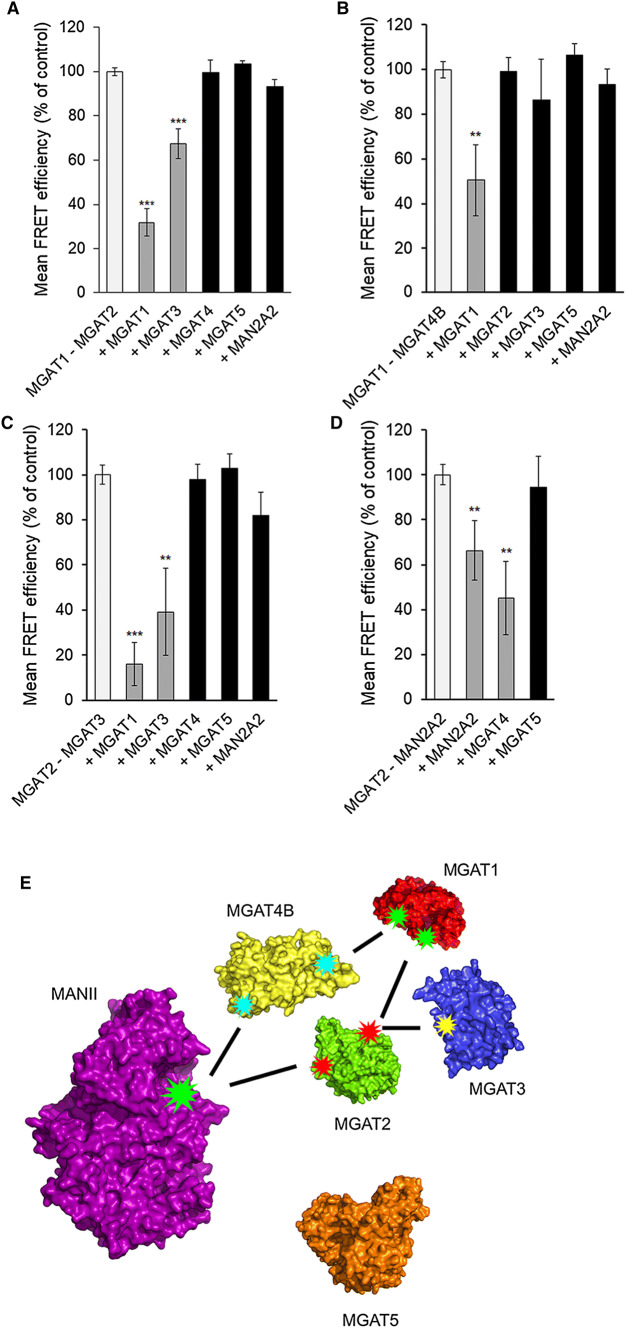
Fig. 2.
Inhibition of detected MGAT interactions with competing HA-tagged MGAT enzyme constructs. a MGAT1/MGAT2 interaction. b MGAT1/MGAT4B interaction. C. MGAT2/MGAT3 interaction. d MGAT2/MANII (MAN2A2) interaction. Cells were triple-transfected using HA-tagged competing constructs together with the depicted FRET pair (left column) in each graph. 24 h later, cells were fixed before quantification of the FRET signal with Operetta High Content Imaging System and calculation of the FRET efficiencies. The data are expressed as percentages (± SD, n = 3) of the control values (set to 100%; no competing construct present). (e) A curated interaction map based on the inhibition data above. Each star represents a single binding interface on each enzyme. Lines pointing to the same interaction surface denote competing interactions between the enzymes. The structures shown were obtained using existing atomic coordinates present in the PDB database. The following ID numbers were used: 2am3 (MGAT1), 5vcm (MGAT2), 5zic (MGAT5). MGAT3 and MGAT4B structures were modelled by ModBase

