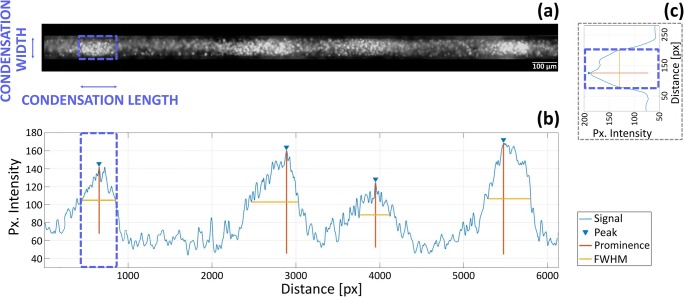
Fig. 3.
Strategy for the analysis of condensation morphology by high content live imaging. a Individual grooves are extracted from the image. b Plot of the fluorescence intensity along the minor axis of the groove for the highlighted condensation. Fluorescence intensity is averaged over the major axis of the groove within the blue box. c Plot of the fluorescence intensity along the major axis of the groove. Fluorescence intensity is averaged over the minor axis of the groove. The light and dark bands in the fluorescence image correspond to peaks and valley in the graph, respectively. Individual condensations are identified by peaks in the plot. Their length is defined by the FWHM of the peak

