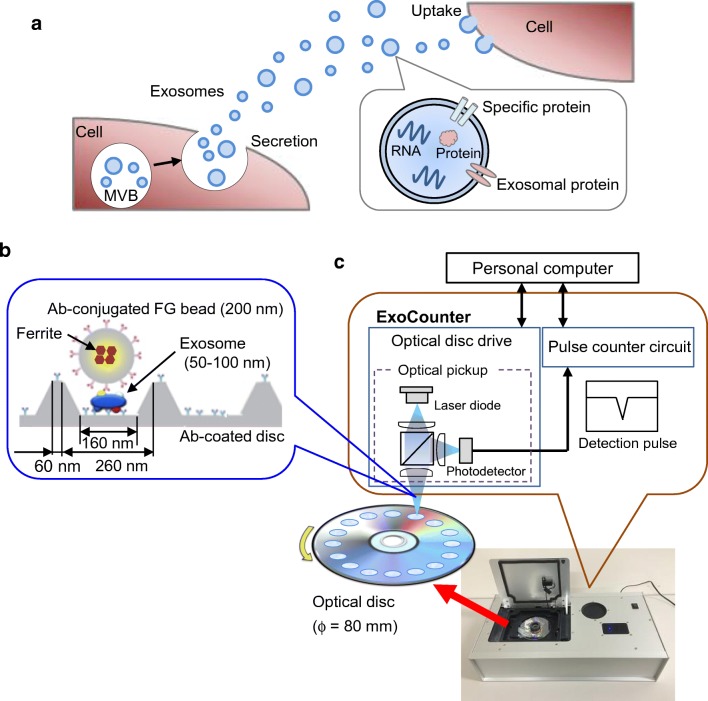
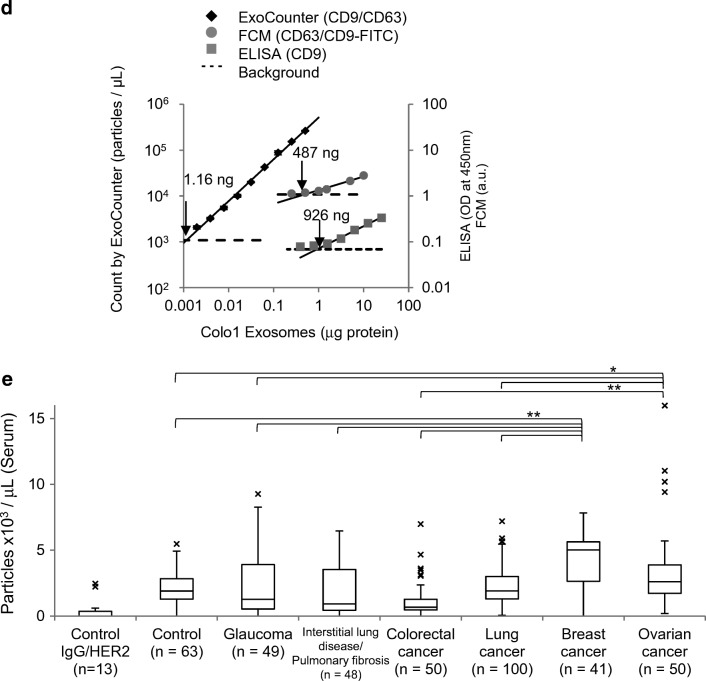
Fig. 3.
Development of a novel counting system using magnetic nanobeads. Overview of exosomes and the ExoCounter system. a Overview of exosomes. When a multivesicular body (MVB) in the cell is fused to the plasma membrane, exosomes are secreted from the cell, delivering genetic material, such as RNAs or proteins, in the membrane to recipient cells. b Illustration of exosomes labeled with nanobeads on an optical disc using the ExoCounter system. Each exosome is isolated in the groove of an optical disc coated with a specific antibody (Ab) for exosomes and covered with an antibody-conjugated single magnetic nanobead (FG bead) that contains ferrite particles. The optical disc has periodic grooves of 260 nm (width) at the top and 160 nm at the bottom, which is suitable for the binding of a single exosome (50–150 nm) or FG bead (200 nm). The width of the convex region was 60 nm to prevent the immobilization of exosomes and FG beads outside the groove. c Optical disc drive of the ExoCounter system. The captured FG beads on the disc are detected by an optical pickup composed of a laser diode and a photodetector. The detection pulses are transferred to the pulse counter circuit to quantify the number of exosomes. d Comparison of Colo1 exosome quantification using the ExoCounter system, enzyme-linked immunosorbent assay (ELISA), and flow cytometry (FCM). e Serum samples were incubated on discs coated with anti-CD9 antibody or a control antibody, then treated with FG beads conjugated to an anti-human epidermal growth factor receptor 2 antibody, and analyzed with the ExoCounter system. Serum samples (12.5 μL) from healthy donors or patients with noncancer diseases (glaucoma or interstitial lung disease/pulmonary fibrosis) or cancer (colorectal, lung, breast, or ovarian cancer) were used in the assay. The data are presented in box plots that represent the first quartile (25%), median (50%), and third quartile (75%). The averages for each group are presented below the graph. Data were analyzed statistically by ANOVA with the Tukey–Kramer test. One asterisk p < 0.05, two asterisks p < 0.01. FITC fluorescein isothiocyanate. (b–e Reproduced from [13], with permission from the American Association for Clinical Chemistry)


