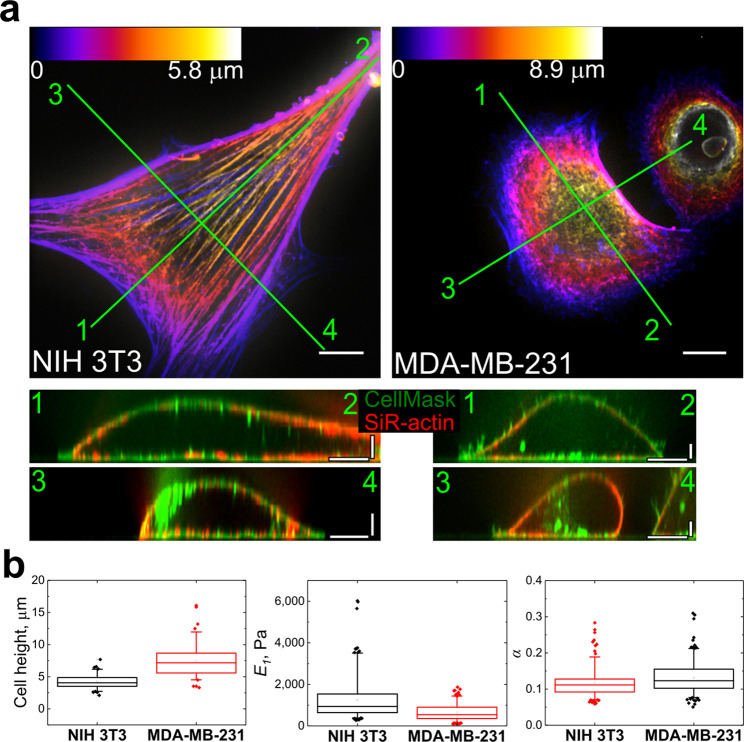
Figure 1.
Morphology and mechanical properties of fibroblasts and cancer cells. (a) F-actin (SiR-actin) structure in NIH 3T3 and MDA-MB-231 cells, the height is colour coded with respect to the scaling shown in the colour scale bars. Vertical cross-sections along the marked lines shows that F-actin is mostly localized in the submembranous region (CellMask staining for plasma membrane). Scale bars 10 μm in the horizontal direction and 2 μm in the vertical direction. (b) Box plots of cell height, Young’s relaxation modulus scale factor E1, and power-law exponent α. The differences between all distributions are significant at the p < 0.001 level.

