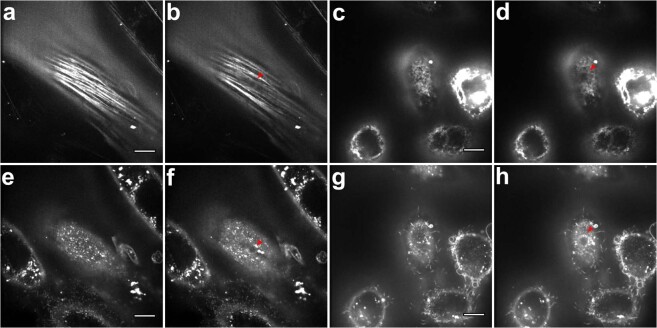
Figure 3.
Deformation of single apical stress fibers in NIH 3T3 fibroblasts (a,b) causes anisotropic (non-axisymmetric) indentation profile (e,f), while isotropic indentation profile is presented in MDA-MB-231 cells (c,d,g,h). Single-plane recording experiment (protocol 2, see Supplementary Information, Section B). SiR-Actin (a–d) and CellMask (e–h) staining for F-actin and the plasma membrane, respectively. The cantilever is above the cell in (a,e,c,g); the bead indents the cell in (b,d,f,h) and its location is marked with red triangles. The perinuclear actin cap fibers located underneath the bead deformed most, going deeper out of the focal plane (b). Anisotropic deformation pattern was also observed with membrane staining as a decrease in the dye intensity along the fiber direction and an extension in the perpendicular direction (f). In MDA-MB-231 cells, isotropic deformation pattern was observed with both stainings revealing a circular indentation profile. Scale bars 10 μm.

