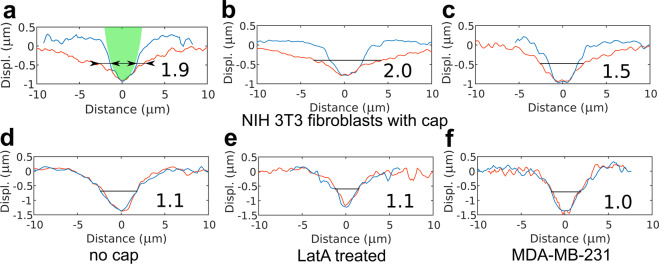
Figure 5.
Examples of the surface displacement profiles for the different cells. The red line is the profile along the apical cap fibers and/or the main cell axis, the blue line is the profile perpendicular to it. The number near the profile is the calculated degree of anisotropy (D.A.). Surface displacement profiles for NIH 3T3 fibroblasts with a well-developed actin cap (a–c), without actin cap (d), after Latrunculin A (LatA) treatment (e) and typical for MDA-MB-231 cell (f) are presented. In (a), the microsphere used as an AFM probe is shown with green for the reference (it has an elliptical shape due to different x-y scaling), and two widths measured at half-depth for calculation of the D.A. are shown with arrows.

