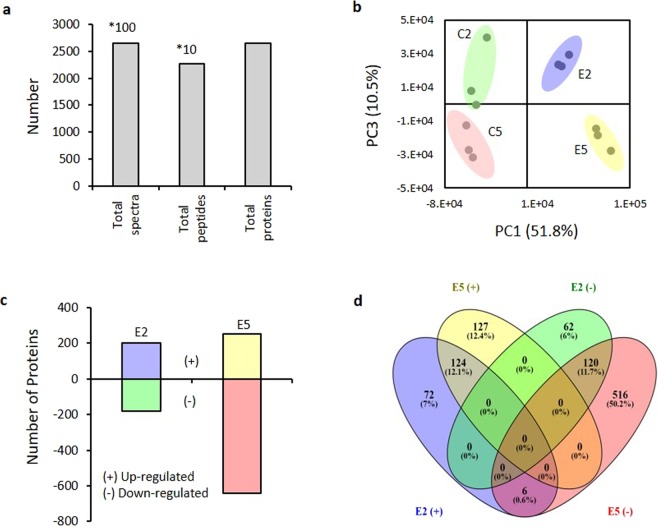
Figure 2.
Overview of the quantitative proteomics analysis. (a) Spectra, peptides and proteins identified from LC/MS-MS proteomics by searching against our S. miltiorrhiza database at critical False Discovery Rates (FDR) of 1%. (b) Principal component analysis (PCA) performed using Markerview. Results represented based on changes in protein regulation. Axes show clear differentiation among samples containing 6 mg g−1 of tanshinones (E2) and 22 mg g−1 of tanshinones (E5) and their respective controls B2 and B5. A different colored circle represents each sample group (ellipses drawn as a guide to the eye). (c) The number of up and down regulated proteins of S. miltiorrhiza at low and high tanshinones concentration obtaining by comparison with their respective control samples. (d) Venn diagram showing the overlap between up- and down-regulated proteins of S. miltiorrhiza at low and high tanshinones concentration.

