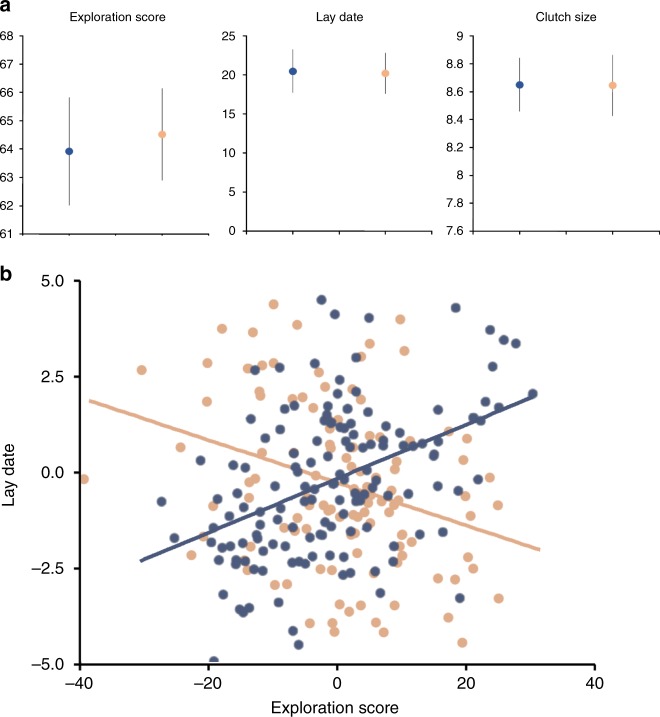
Fig. 2.
Responses to perceived predation level (PPL) manipulations. a Differences in traits depending on PPL exposure. Data are means with error bars representing standard error for each unique combination of treatment group and measured trait (exploration score, lay date, clutch size), illustrating the absence of an effect of treatment on mean values detected by our analyses printed in Table 1. Colored dots represent treatment (blue: low PPL: orange: high PPL). b Relationship between exploration score and lay date depending on PPL exposure. Points are individual’s best linear unbiased predictors for lay date (y axis) and exploration score (x axis). These represent our best estimate of an individual’s average value for the two focal traits corrected for the sample size per individual. Colored dots represent treatment (blue: low PPL: orange: high PPL). Source data are provided as a Source Data file, total sample size is 326 individuals, 172 in low PPL, 154 in high PPL)

