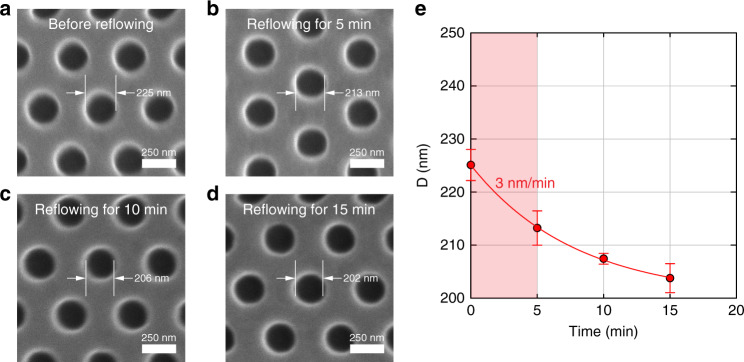
Fig. 3. Determination of shrinkage rate for the post-NIL polymer reflow process.
a An SEM image of an SU-8 membrane with an array of nanopores prior to undergoing the polymer reflow process. b–d SEM images of the SU-8 membrane shown in (a) after undergoing polymer reflow at 45 °C for 5, 10, and 15 min, respectively. e The diameter of the nanopores as a function of time for the post-NIL reflow process. The shrinkage rate, i.e., the slope of the curve, decreased with time. The initial shrinkage rate determined from the red zone was ~ 3 nm/min. NIL, nanoimprint lithography; SEM, scanning electron microscopy

