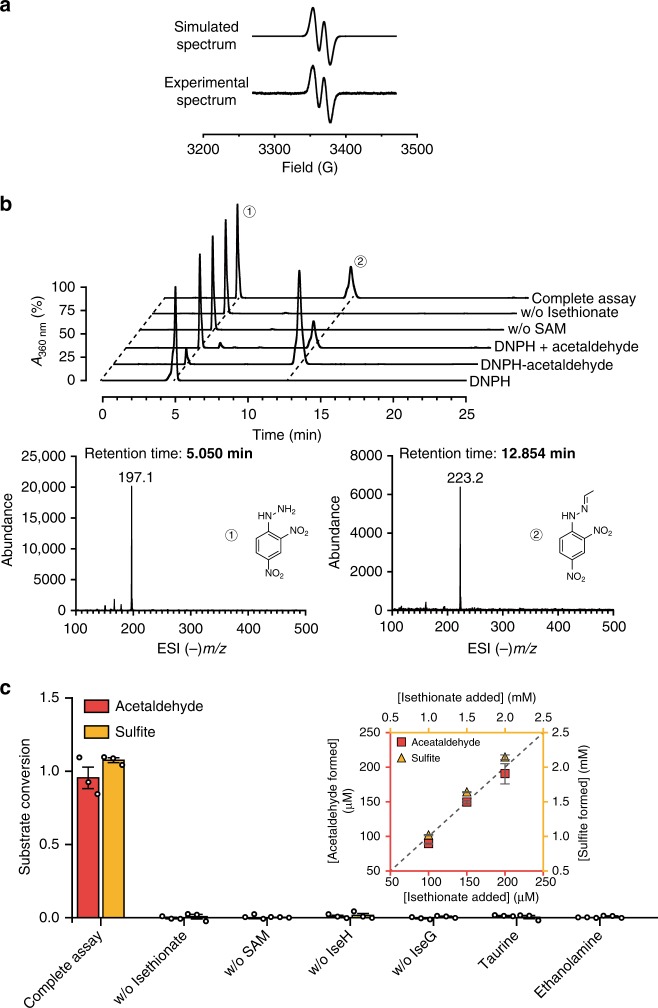
Fig. 2.
EPR spectra and enzymatic assays. a X-band EPR spectrum of IseG reconstituted with IseH and SAM in the presence of reductant (Ti (III) citrate). b Detection of acetaldehyde formation in the IseG-catalyzed isethionate cleavage using LC-MS/MS. HPLC elution profiles of the DNPH derivatives from the reaction products, reaction negative controls, and authentic standards (theoretical mass of the monoanion of DNPH = 197.1, and DNPH-acetaldehyde = 223.2), are presented. Negative ionization mass spectra of the peaks 1 and 2 from the HPLC trace show that they contain DNPH and DNPH-acetaldehyde, respectively. c Enzymatic assays showing the fraction of substrate converted to acetaldehyde and sulfite under different reaction conditions, demonstrating the reaction requirements and substrate specificity. The inset shows the stoichiometric conversion of isethionate into acetaldehyde and sulfite. The error bars represent the standard deviation of three individual experiments. Source data are provided as a Source Data file

