Fig. 6.
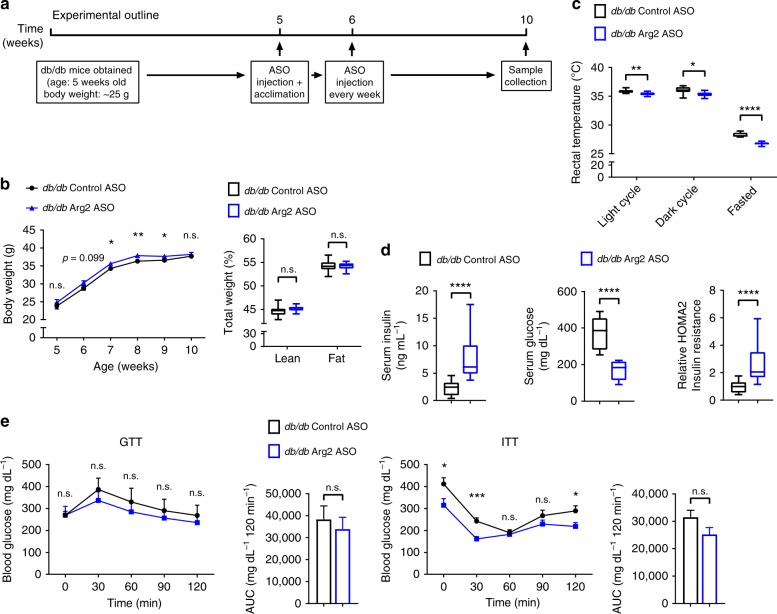
Hepatic Arg2 deficiency exacerbates hyperinsulinemia in db/db mice. a Experiment schematic used to test the role of hepatic Arg2 knockdown in db/db mice. b Body weight and body composition of Control ASO or Arg2 ASO-treated db/db mice (n = 8 mice per group). c Rectal temperature in db/db Control ASO or Arg2 ASO mice (n = 8 mice per group). d Serum insulin (left), glucose (middle), and HOMA2 IR (right) in Control ASO or Arg2 ASO-treated db/db mice (n = 8 mice per group). e Intraperitoneal glucose tolerance test (GTT) and insulin tolerance test (ITT) (n = 5 mice per group). For box plots, the midline represents the median, boxes represent the interquartile range and whiskers show the full range of values. For bar graphs, data represent mean+s.e.m. *P < 0.05, **P < 0.01, ***P < 0.005, ****P < 0.0001; n.s., not significant; relative to control treatment, by two-tailed Student’s t-test

