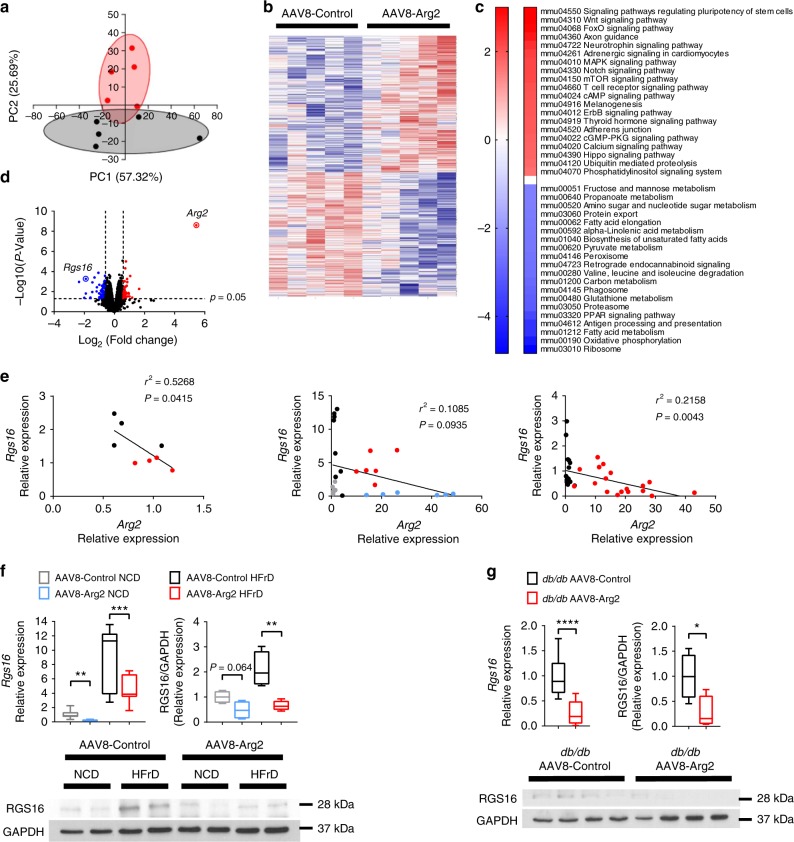
Fig. 8.
Inverse Arg2-RGS16 regulatory relationship is identified by unbiased transcriptomics. a Principal component analysis of transcriptomic data from db/db AAV8-Control and AAV8-Arg2 livers. b Heat map demonstrating gene-level regulation in db/db AAV8-Control and AAV8-Arg2 livers. c KEGG pathway analysis demonstrating top up- and downregulated gene pathways in db/db AAV8-Arg2 livers. d Volcano plot demonstrating significantly altered genes by expression level and P-value. RGS16 and Arg2 are highlighted as highly regulated genes identified within the dataset. e Linear regression analysis demonstrating inverse Arg2 and RGS16 correlation in (left to right:) db/+ versus db/db livers, in HFrD-fed AAV8-control and AAV8-Arg2 mice, and in db/db AAV8-control and AAV8-Arg2 mice. f, g RGS16 gene expression and protein abundance in HFrD-fed (f) and db/db (g) AAV8-control and AAV8-Arg2 mouse livers. For box plots, the midline represents the median, boxes represent the interquartile range and whiskers show the full range of values. *P < 0.05, **P < 0.01, ***P < 0.005, ****P < 0.0001; n.s., not significant; relative to control treatment, by two-tailed Student’s t-test

