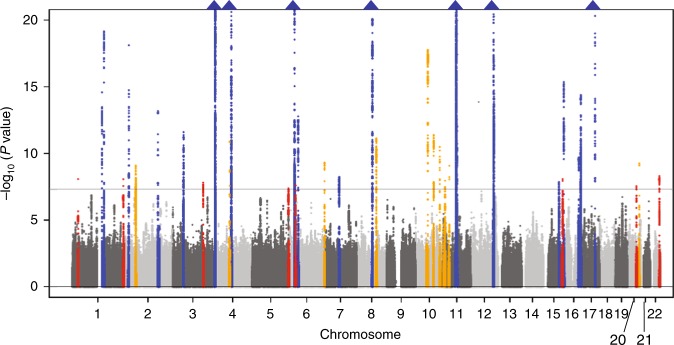
Fig. 1.
Manhattan plot for the meta-analysis of SUA. The horizontal line represents the genome-wide significance level (α = 5 × 10⁻⁸). Eighteen loci shown in orange were also recently identified by BBJ as being associated with SUA, 10 loci in blue were also identified by other studies and those in red indicate eight novel loci identified in the present study. Blue triangles represent loci containing SNPs with P values of <1 × 10⁻²⁰. SUA serum uric acid, BBJ BioBank Japan

