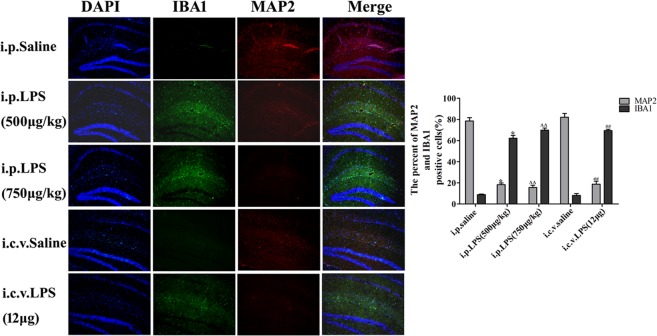
Figure 4.
Expression of MAP-2 and IBA-1 in the LPS-induced mouse model of memory and learning impairment. Immunostaining of IBA-1 (green) and MAP-2 (red) proteins in the hippocampus was performed with specific primary antibodies, quantified images of n = 5 per group. Graph is plotted as the mean + SEM. *P < 0.05, **P < 0.01 LPS (i.p. 500 μg/kg) compared to the i.p. saline group; ΔP < 0.05, ΔΔP < 0.01 LPS (i.p. 750 μg/kg) compared to the i.p. saline group; #P < 0.05, ##P < 0.01, LPS (i.c.v. 12 μg) compared to the i.c.v. saline group.

