Fig. 1.
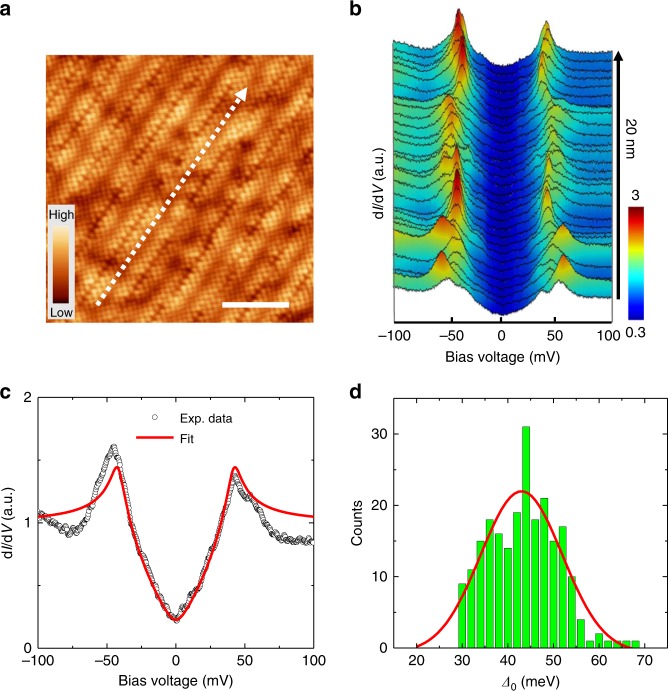
Topographic image and tunneling spectra measured on optimally doped Bi-2212. a A typical topographic image of the BiO surface after cleavage measured at bias voltage Vbias = 50 mV and tunneling current It = 100 pA. Scale bar, 5 nm. b Tunneling spectra measured along the arrowed line in a. The set-point conditions are Vset = 100 mV and Iset = 100 pA for measuring all the spectra in b. c A typical spectrum (open circles) selected from b. The solid line shows the Dynes model fitting result with a d-wave superconducting gap. d The statistics of superconducting gap maxima Δ0 for about 200 tunneling spectra measured on the Bi-2212 samples, and the gap maximum values are determined from the positions of the coherence-peaks. The red curve is a Gaussian fitting result with the peak position near 43 meV

