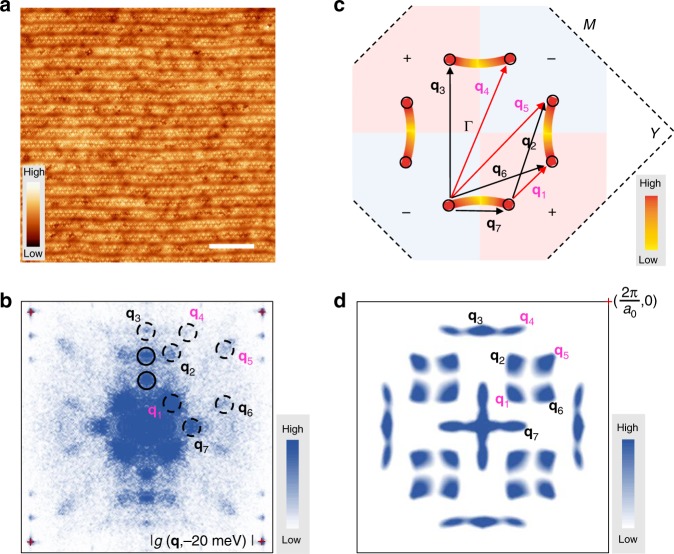
Fig. 2.
Different kinds of scattering wave-vectors in FT-QPI pattern. a Topographic image of the BiO plane (Vbias = −200 mV, It = 50 pA). Scale bar, 10 nm. b FT-QPI pattern (Vset = −100 mV, Iset = 100 pA) at E = −20 meV based on the QPI image measured in the area of a. Four Bragg peak positions are marked by the red crosses. The solid-line circles indicate the scattering spots contributed by the supermodulations, while the dashed circles indicate the primary scattering spots with different q vectors. c A schematic plot of the contours of constant energy. The DOS along the Fermi surface is set to be k-dependent, and the intensities at the octet ends of CCE are the strongest. The different colors of light pink and light blue show the regions with different gap signs for the d-wave gap function. The scatterings along black arrows (q2, q3, q6, and q7) are for sign reversal gaps, while the scatterings along magenta arrows (q1, q4, and q5) are sign-preserved ones. d The simulation of FT-QPI by applying the self-correlation to c

