Fig. 4.
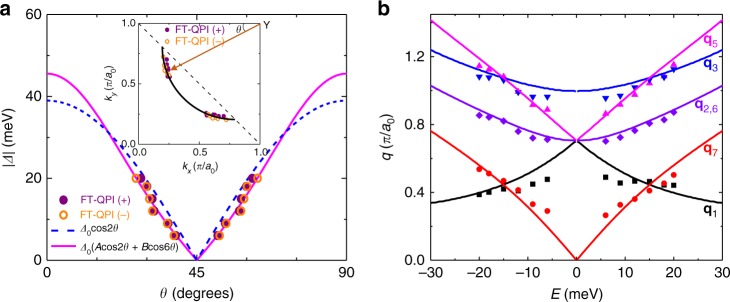
Energy dispersions for characteristic scattering wave vectors and superconducting gap. a Superconducting gap Δ(θ) (circles) and two fitting curves by different d-wave gap functions. The inset in a shows the positions of the ends of CCE determined by q1 and q7 measured at various energies. The solid line shows the Fermi surface from the fitting to these positions by a circular arc, and it is cut off by the dashed line. The angle θ for each end of CCE is defined in the inset. The gap value Δ for each end of CCE is equivalent to the energy at which the QPI data are measured. b Energy dispersion of the scattering wave vectors taken from the FT-QPI data (excluding q4 due to very weak intensity). The solid lines represent the theoretical predictions based on the Fermi surface and the d-wave gap function with high order shown by the line with magenta color in a

