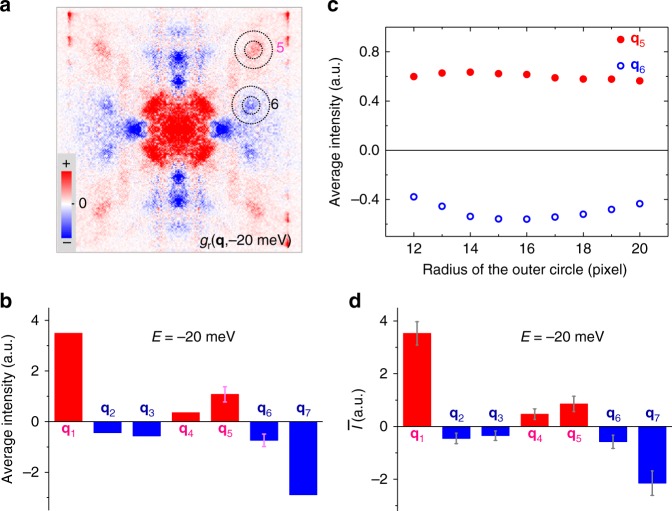
Fig. 6.
Control experiments and error analysis of the PR-QPI signal. a Experimental PR-QPI pattern measured on another sample and analyzed by multi-DBS-QPI method. b Averaged intensity per pixel of PR-QPI signal for each scattering spot. c The averaged intensity of the PR-QPI signal within the two circles shown in a. This calculation for determining possible error bars is specially done for q5 and q6 spots with the increasing size of the outer circle. The averaged values of these data are taken as the error bars for q5 and q6 spots and shown in b. d The average of the intensities for each scattering spots measured in four areas of three samples at ±20 meV. The error bars in d are calculated through the standard deviations from the statistics. Note the error bars in b and d have different meanings. Those in b give the uncertainty of the PR-QPI intensity calculated for a particular scattering spot in one FOV. Those in d reflect the uncertainty among different FOVs and samples

