Figure 5.

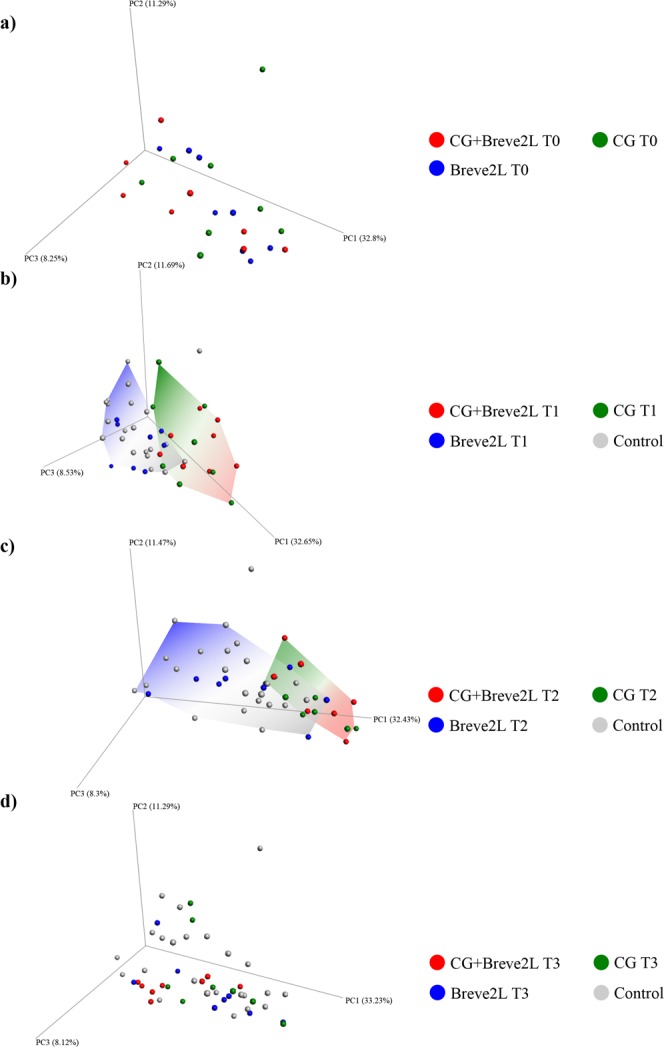
Beta-diversity of CG, Breve2L and CG + Breve2L at T0, T1, T2 and T3 time points. Panels a,b,c and d report three dimensional PCoA obtained using Weighted Unifrac index for T0, T1, T2 and T3 time points, respectively.

Beta-diversity of CG, Breve2L and CG + Breve2L at T0, T1, T2 and T3 time points. Panels a,b,c and d report three dimensional PCoA obtained using Weighted Unifrac index for T0, T1, T2 and T3 time points, respectively.