Fig. 7.
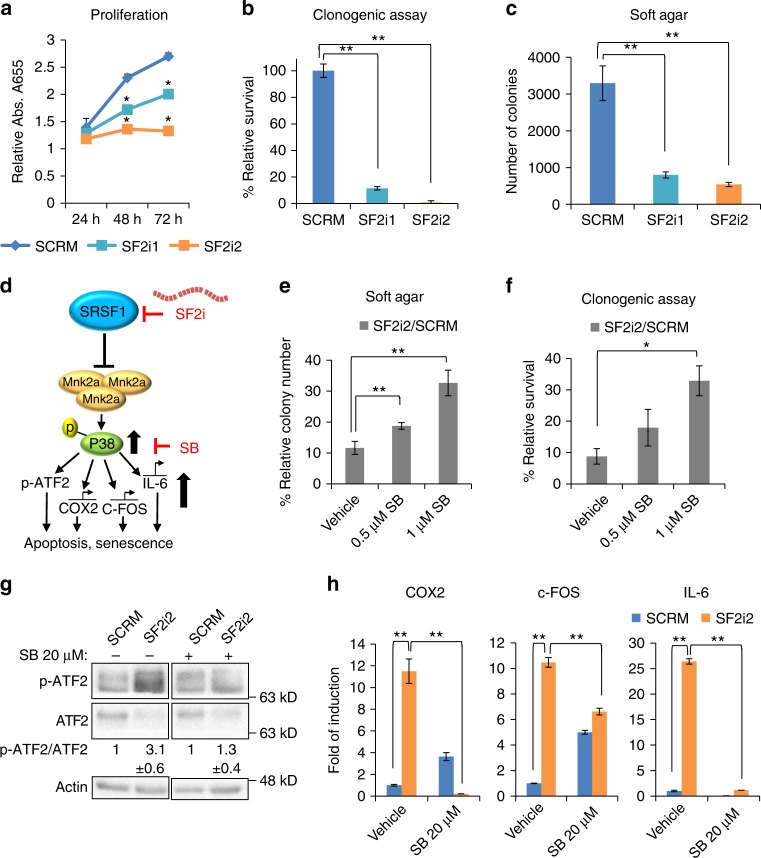
Inhibition of glioblastoma cells by SRSF1 decoys is partially reversed by SB203580. a Proliferation assay of U87MG cells after transfection with 2.5 µM of indicated decoy oligonucleotides. Four hours after transfection 4000 cells/well were seeded in six replicates. *p-value ≤0.02 for SF2i2 at 24 h, **p-value ≤0.0004 at 48 and 72 h. Data represent means ± SD of six replicates. b Graph of clonogenic assay (1000 cells/well) of transfected cells described in a. **p-value <0.003. Data represent means ± SD of four independent biological samples. c Quantification of soft agar colony growth assay on transfected cells described in a. Graphs represent quantification of 10 fields counted in duplicate (total of 20 fields). **p-value <1.1E–17. Data represent means ± SD of two wells. d Scheme representing SRSF1 effects on the p38-MAPK signaling pathway. SF2i1/SF2i2 oligonucleotides (SF2i), SB203580 (SB). e Quantification of soft agar colony growth assay on transfected cells described in a treated with the indicated concentrations of SB. Relative survival is based on quantification of 10 fields counted in duplicate (total of 20 fields). **p-value <0.002. Data represent means ± SD of two wells. f Quantification of clonogenic assay of cells described in a treated with the indicated concentrations of SB. *p-value = 0.02. Data represent means ± SD of duplicates. g Western blot analysis of cells described in e. Quantification of SF2i2 + vehicle is normalized to SCRM + vehicle, and SF2i2 + SB is normalized to SCRM + SB. Data represent means ± SD of four biological samples. h RT- qPCR of p38 pathway targets in cells described in e. Values are normalized to actin and SCRM without vehicle is arbitrarily set at 1. *p-value = 0.02, **p-value ≤0.003. Data represent means ± SD of triplicates. p-values were calculated using Student's t-test (two-tailed)

