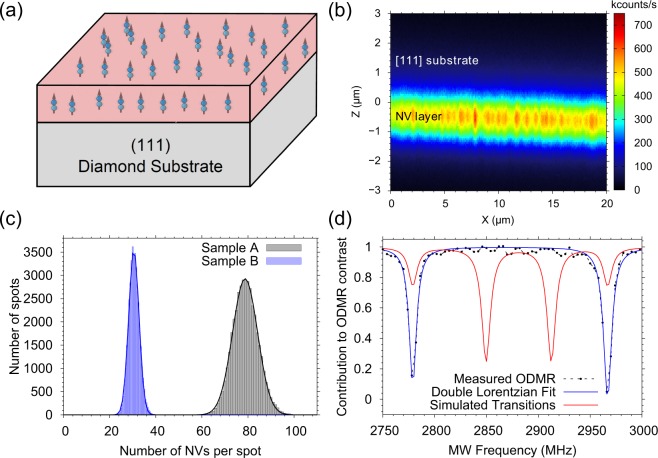
Figure 2.
(a) Schematic drawing of the diamond layers fabricated in this work. The arrows represent NV centres aligned along the [111] crystal axis. (b) Confocal image showing a cross section of a sample, where the fluorescence from the NVs in the diamond layer is labelled. (c) Histogram from the analysis of Samples A and B, showing the increased number of NVs in the layer grown at higher MW power. (d) ODMR spectrum showing the preferential alignment of the ensemble of NV centres. Black points are experimentally measured data whereas the blue solid line is a Lorentzian Fit to the data and the red line represents the simulated ODMR transitions at the applied external magnetic field. The transitions at 2776 Mhz and 2964 Mhz belong to [111] oriented NVs whereas the other correspond to the other three directions.

