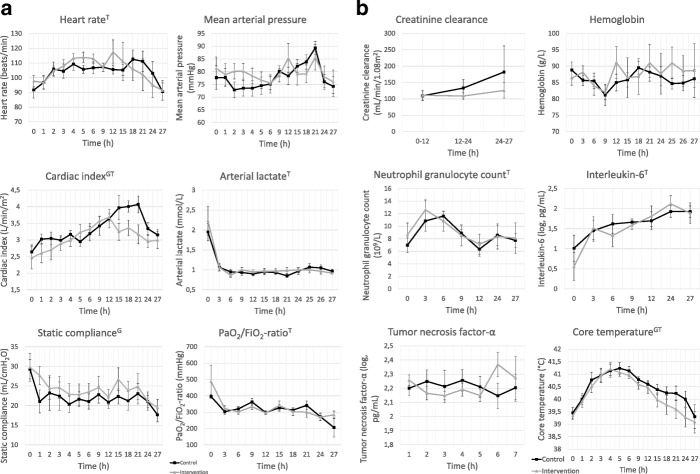
Fig. 1.
a Graphs representing physiological parameters and laboratory analysis over time. Data points represent mean and error bars represent SEM. Black line represents the control group and gray line represents the intervention group. G, significant group difference; T, significant difference over time. No parameters had a significant group-time interaction. b Graphs representing physiological parameters and laboratory analysis over time. Data points represent mean and error bars represent SEM. Black line represents the control group and gray line represents the intervention group. G, significant group difference; T, significant difference over time. No parameters had a significant group-time interaction

